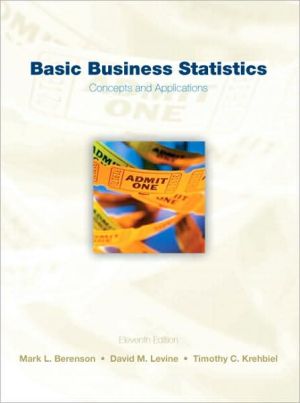
Basic Business Statistics: Concepts and Applications
Berenson shows students how statistics is use in each functional area of business.\ This edition features statistics in real-business scenarios, web cases, data analysis and interpretation of software results, case studies and team projects, as well as visual explorations of statistical concepts.\ This book is intended for undergraduate and graduate students taking courses in statistics.
Search in google:
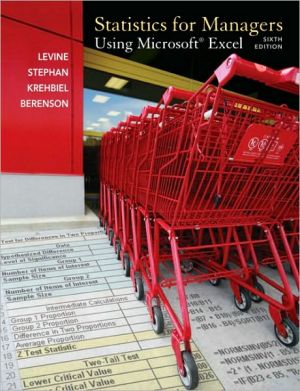
This introductory statistics text focuses on the functional areas of business: accounting, economics and finance, information systems, management, and marketing. Changes to this edition include a discussion of obtaining information from the Internet and examples from e-commerce. Annotation © Book News, Inc., Portland, OR Booknews Using case studies and chapter review problems, the authors attempt to make statistics and its business applications with Microsoft Excel software as painless as possible. After making the case for what's in it for productivity and quality-minded managers, they ease into Excel functions for analyzing and presenting data, hypothesis testing, regression, and time-series analysis. Appends a math and algebra review, summation notation, standard statistical tables and symbols, special data sets for team projects, and documentation for the CD-ROM files. Indexed by book subjects and Microsoft Excel features. The CD-ROM includes the PHStat statistics add-in for Excel for use in business statistics courses. Annotation c. by Book News, Inc., Portland, Or.
Educational Philosophy\ In our many years of teaching introductory statistics courses, we have continually searched for ways to improve the teaching of these courses. Our vision for teaching these introductory business statistics courses has been shaped by active participation in a series of Making Statistics More Effective in Schools of Business, Decision Sciences Institute, and American Statistical Association conferences as well as the reality of serving a diverse group of students at large universities. Over the years, our vision has come to include these principles:\ \ Students need a frame of reference when learning statistics, especially since statistics is not their major. That frame of reference for business students should be the functional areas of business—that is, accounting, economics and finance, information systems, management, and marketing. Each statistical topic needs to be presented in an applied context related to at least one of these functional areas.\ Virtually all the students taking introductory business statistics courses are majoring in areas other than statistics. Introductory courses should focus on underlying principles that nonstatistics majors will find useful.\ The use of spreadsheet and/or statistical software should be integrated into all aspects of an introductory statistics course. In the workplace, spreadsheet software (and sometimes statistical software) is usually available on a decision maker's desktop. Our teaching approach needs to recognize this reality, and we need to make our courses more consistent with the workplace environment.\ Textbooks that use software must provide enoughinstructions that students can effectively use the software, without the software (and instruction) dominating the course.\ The focus in teaching each topic should be on the application of the topic to a functional area of business, the interpretation of results, the presentation of assumptions, the evaluation of the assumptions, and the discussion of what should be done if the assumptions are violated. These points are particularly important in regression and forecasting and in hypothesis testing. Although the illustration of some computations is inevitable, the focus on computations should be minimized.\ Both classroom examples and homework exercises should relate to actual or realistic data as much as possible. Students should work with data sets, both small and large, and be encouraged to look beyond the statistical analysis of data to the interpretation of results in a managerial context.\ Introductory courses should avoid an overconcentration on one topic area (such as hypothesis testing) and instead provide breadth of coverage of a variety of statistical topics. This will help students avoid the "I can't see the forest from the trees" syndrome.\ \ New to This Edition\ This new eighth edition of Basic Business Statistics: Concepts and Applications has been vastly improved in a number of important areas.\ APPLICATIONS\ Updated and improved Using Statistics business scenarios—Each chapter begins with a Using Statistics example that shows how statistics can be used in one of the functional areas of business—accounting, finance, information systems, management, or marketing. This scenario is used throughout the chapter to provide an applied context for the concepts. The following are the Using Statistics scenarios presented throughout the book:\ \ Hundreds of new applied examples and exercises, with data from the Wall Street Journal, USA Today, and other sources have been added to the text.\ Visual Explorations—Provided on the book's accompanying CDROM are visual explorations that allow students to interactively explore important statistical concepts in descriptive statistics, probability, the normal distribution, and regression analysis. For example, in descriptive statistics, students observe the effect of changes in the data on the average, median, quartiles, and standard deviation. In sampling distributions, students use simulation to explore the effect of sample size on a probability distribution. With the normal distribution, students see the effect of changes in the mean and standard deviation on the areas under the normal curve. In regression analysis, students have the opportunity of fitting a line and observing how changes in the slope and intercept affect the goodness of fit of the fitted line.\ Using Microsoft Office is a new feature. Located at the ends of chapters 2 and 3, this feature enables the student to prepare reports by using Microsoft Office tools. This section shows stepbystep how to paste Microsoft Excel tables and charts into a Microsoft Word document and how to prepare PowerPoint presentations.\ \ EXERCISES\ \ Answers to most evennumbered exercises are provided at the end of the book.\ Report Writing Exercises allow students to place the results of an analysis in a business context by incorporating Microsoft Office techniques such as pasting ' Microsoft Excel tables and charts into a Microsoft Word document and PowerPoint 1 presentation.\ Internet Exercises, located on the book's web site, allow students to explore data sources that are available on the World Wide Web.\ Case Studies and Team Projects—Detailed case studies are included at the ends of many chapters. The Springville Herald case is included at the end of most chapters as an integrating theme. A team project relating to mutual funds is also included at the end of most chapters as an integrating theme.\ \ SOFTWARE\ \ Emphasis on data analysis and interpretation of computer output—We take the position that the use of computer software (Microsoft Excel or a statistical software package such as Minitab) is an integral part of learning statistics. Our focus emphasizes analyzing data, interpreting the output from Microsoft Excel and Minitab, and explaining how to use this software while reducing emphasis on doing computations. Therefore, we have added a great deal of computer output and integrated this output into the fabric of the text. For example, in the coverage of tables and charts in Chapter 2, the focus is on the interpretation of various charts, not on their construction by hand. In our coverage of hypothesis testing in Chapters 9 through 12, extensive computer output has been included so that the pvalue approach can be used. In our coverage of simple linear regression in Chapter 13, it is assumed that Microsoft Excel or Minitab will be used, and thus the focus is on the interpretation of the output and not on hand calculations (which have been placed in a separate section of the chapter).\ PHStat2 is Prentice Hall's Excel addin, which provides a custom menu of topics that supplement the Data Analysis Tool of Microsoft Excel. Using Excel and PHStat2, the user is able to perform statistical analysis for virtually all the topics that would be covered in a twoterm business statistics course at the introductory level. PHStat2, an updated version of PHStat, includes new features such as tables, charts, and a help system.\ Endofchapter appendices on Microsoft Excel and Minitab, with screen shots, provide easytofollow instructions.\ \ CONTENT CHANGES IN THE EIGHTH EDITION\ \ Chapters 1 and 2 have been combined into a single chapter ("Introduction and Data Collection"). This updated chapter provides explanation of how to obtain data from the World Wide Web, contains additional chapter review problems on accessing the World Wide Web, and contains a new Using Statistics example involving an ecommerce company.\ Chapter 2 ("Presenting Data in Tables and Charts") contains an updated Using Statistics example, new graphical excellence examples, a section on the scatter diagram, and a section on placing Microsoft Excel worksheet data and charts into Microsoft Word documents.\ Chapter 3 ("Descriptive Statistics") contains an updated Using Statistics example, additional integration of Excel and Minitab output, coverage of the correlation coefficient, coverage of the geometric mean (which finance students especially need), a Visual Explorations module for descriptive statistics, and placing Microsoft Excel worksheet data and charts in PowerPoint presentations.\ Chapter 4 ("Basic Probability") includes an appendix on PHStat2.\ Chapter 5 ("Some Important Discrete Probability Distributions") changes the Using Statistics binomial example to an accounting information system, moves covariance so that it follows expected value, and uses an example with a negative covariance.\ Chapter 6 ("The Normal Distribution") changes the Using Statistics example to an Internet example, uses only the cumulative normal table, integrates Excel and Minitab output into the normal distribution section, and contains a Visual Exploration module for the normal distribution.\ Chapter 7 ("Sampling Distributions") streamlines the introductory section, contains a visual exploration module for sampling distributions, contains a Visual Explorations module for sampling distributions, and puts the section on the finite population correction factor on the CDROM.\ Chapter 8 ("Confidence Interval Estimation") adds onesided confidence intervals to the section on auditing and moves the finite population correction factor to the CDROM.\ Chapter 9 ("Fundamentals of Hypothesis Testing: OneSample Tests") adds computer output to all sections and combines sections 9.2 and 9.3 so that pvalue is not a separate section.\ Chapter 10 ("TwoSample Tests with Numerical Data") changes the Using Statistics example to one related to marketing, provides additional emphasis on pvalues, and adds the confidence interval estimate for the difference between two means.\ Chapter 11 ("Analysis of Variance") changes the Using Statistics example, adds computer output, provides additional emphasis on pvalues and substitutes the modified Levene test for the Hartley test.\ Chapter 12 ("Tests for Two or More Samples with Categorical Data") adds the confidence interval estimate for the difference between two proportions.\ Chapter 13 ("Simple Linear Regression") adds additional coverage of PHStat2 and contains a Visual Explorations module on regression.\ Chapter 14 ("Introduction to Multiple Regression") changes the Using Statistics example to a marketing problem.\ Chapter 15 ("Multiple Regression and Model Building") includes additional discussion of interaction terms in multiple regression and adds new PHStat2 features to the section on stepwise regression and confidence intervals for the mean response.\ Chapter 16 ("TimeSeries Analysis") changes the Using Statistics example and adds a section on index numbers that is on the CDROM.\ Chapter 17 ("Decision Making") has been moved after regression and time series forecasting and adds a section on PHStat2.\ Chapter 18 ("Statistical Applications in Quality and Productivity Management") has been moved after the regression and time series chapters and adds a section on process capability.\ \ SUPPLEMENT PACKAGE\ The supplement package that accompanies this text includes the following:\ \ Instructor's Solution Manual—This manual includes extra detail in the problem solutions and many Excel and Minitab solutions.\ Student Solutions Manual—This manual provides detailed solutions to virtually all the evennumbered exercises.\ Test Item File—This supplement includes extra Excelbased test questions.\ Instructor's CD/ROM—The instructor's CDROM contains PowerPoint slides, the Instructor's Solutions Manual and Test Item File, and Prentice Hall's Custom Test Manager.\ PHStat2—This is a statistical addin for Microsoft Excel. The data files for the examples and exercises are contained on the CDROM that accompanies the text.\ MyPHLIP Web site—This site contains additional problems, teaching tips, tips for students, current events exercises, practice exams, and links to other sites that contain statistical data.\ Student version of Minitab—For a reasonable additional cost, a student version of Minitab can be packaged with this text. To order this package, use ISBN 0130720402.\ \ This site incorporates the features of MyPHLIP (Prentice Hall's Learning on the Internet Partnership), a robust Web site that provides many resources for both faculty members and students. A partial list of the features includes:\ \ Teaching tips\ Links to other sites that provide data appropriate for statistics courses\ Student tips\ Sample exams\ Current event exercises\ Internet exercises\
Ch. 1Introduction and Data Collection1Supplement: Using Microsoft Excel for Statistical Analysis29Ch. 2Presenting Data in Tables and Charts63Ch. 3Summarizing and Describing Numerical Data151Ch. 4Basic Probability and Discrete Probability Distributions209Ch. 5Decision Making289Ch. 6The Normal Distribution and Sampling Distributions329Ch. 7Confidence Interval Estimation413Ch. 8Fundamentals of Hypothesis Testing: One-Sample Tests479Ch. 9Two-Sample Tests with Numerical Data537Ch. 10ANOVA and Other c-Sample Tests with Numerical Data603Ch. 11Two-Sample and c-Sample Tests with Categorical Data669Ch. 12Statistical Applications in Quality and Productivity Management721Ch. 13Simple Linear Regression and Correlation771Ch. 14Multiple Regression Models853Ch. 15Time-Series Analysis935Answers to Selected Problems1025App. AReview of Arithmetic and AlgebraApp. BSummation NotationApp. CStatistical Symbols and Greek AlphabetApp. D Special Data SetApp. E TablesApp. F Documentation for CD-ROM FilesIndexExcel Index
\ BooknewsUsing case studies and chapter review problems, the authors attempt to make statistics and its business applications with Microsoft Excel software as painless as possible. After making the case for what's in it for productivity and quality-minded managers, they ease into Excel functions for analyzing and presenting data, hypothesis testing, regression, and time-series analysis. Appends a math and algebra review, summation notation, standard statistical tables and symbols, special data sets for team projects, and documentation for the CD-ROM files. Indexed by book subjects and Microsoft Excel features. The CD-ROM includes the PHStat statistics add-in for Excel for use in business statistics courses. Annotation c. by Book News, Inc., Portland, Or.\ \
