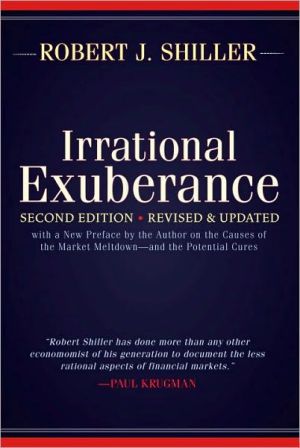
Irrational Exuberance
As Robert Shiller’s new 2009 preface to his prescient classic on behavioral economics and market volatility asserts, the irrational exuberance of the stock and housing markets “has been ended by an economic crisis of a magnitude not seen since the Great Depression of the 1930s.” As we all, ordinary Americans and professional investors alike, crawl from the wreckage of our heedless bubble economy, the shrewd insights and sober warnings, and hard facts that Shiller marshals in this book are...
Search in google:
Shiller credits an unprecedented confluence of events with driving stocks to uncharted heights. He analyzes the structural and psychological factors that explain why the Dow Jones Industrial Average tripled between 1994 and 1999, a level of growth not reflected in any other sector of the economy. In contrast to many analysts, Shiller stresses circumstances that alter investors' perceptions of the market. These include the entry of the Internet into American homes, the misimpression that the aging of the baby-boom generation builds long-term protection into the market, and herd behavior, such as day-trading. He also examines cultural factors, including sports-style media coverage of the Dow's ups and downs and "new era" thinking about the economy. He considers and challenges efforts to rationalize exuberance that are based on either efficient-markets theory, narrowly construed, or the claim that investors have only recently learned the true value of the market. In the most controversial portion of the book, Shiller cautions that a market that is overvalued by historical standards is inherently precarious. Among his prescriptions is an urgent plea to immediately end what he argues are perilous schemes to privatize social security in favor of plans to reformit. He also argues that private pension plans that encourage many people to put their entire retirement funds in the stock market should be modified. And he calls on our savings and investment institutions to take more sensible account of emerging risk-management principles. Shiller's analysis is convincingly documented, and regardless of the market's future behavior his book will stand as an important elaboration of why stocks soared and what our investment alternatives are. Australian Finance Review - Joanne Gray The stockmarket's most prominent bull, Goldman Sachs analyst Ms Abby Joseph Cohen, and Professor Robert Shiller , a scholar who argues that the market's levels are based on overconfidence, agree on at least one issue: market psychology is as much a determinant of share prices as underlying fundamentals.
\ \ \ \ Chapter One\ \ \ The Stock Market Level in Historical Perspective\ When Alan Greenspan, chairman of the Federal Reserve Board in Washington, used the term irrational exuberance to describe the behavior of stock market investors in an otherwise staid speech on December 5, 1996, the world fixated on those words. Stock markets dropped precipitously. In Japan, the Nikkei index dropped 3.2%; in Hong Kong, the Hang Seng dropped 2.9%; and in Germany, the DAX dropped 4%. In London, the FT-SE 100 index was down 4% at one point during the day, and in the United States, the Dow Jones Industrial Average was down 2.3% near the beginning of trading. The words irrational exuberance quickly became Greenspan's most famous quote—a catch phrase for everyone who follows the market.\ Why did the world react so strongly to these words? One view is that they were considered simply as evidence that the Federal Reserve would soon tighten monetary policy, and the world was merely reacting to revised forecasts of the Board's likely actions. But that cannot explain why the public still remembers irrational exuberance so well years later. I believe that the reaction to these words reflects the public's concern that the markets may indeed have been bid up to unusually high and unsustainable levels under the influence of market psychology. Greenspan's words suggest the possibility that the stock market will drop—or at least become a less promising investment.\ History certainly gives credence to this concern. In the balance of this chapter, we study the historical record. Although the discussion in this chapter getsprettydetailed, I urge you to follow its thread, for the details place today's situation in a useful, and quite revealing, context.\ Market Heights\ By historical standards, the U.S. stock market has soared to extremely high levels in recent years. These results have created a sense among the investing public that such high valuations, and even higher ones, will be maintained in the foreseeable future. Yet if the history of high market valuations is any guide, the public may be very disappointed with the performance of the stock market in coming years.\ An unprecedented increase just before the start of the new millennium has brought the market to this great height. The Dow Jones Industrial Average (from here on, the Dow for short) stood at around 3,600 in early 1994. By 1999, it had passed 11,000, more than tripling in five years, a total increase in stock market prices of over 200%. At the start of 2000, the Dow passed 11,700.\ However, over the same period, basic economic indicators did not come close to tripling. U.S. personal income and gross domestic product rose less than 30%, and almost half of this increase was due to inflation. Corporate profits rose less than 60%, and that from a temporary recession-depressed base. Viewed in the light of these figures, the stock price increase appears unwarranted and, certainly by historical standards, unlikely to persist.\ Large stock price increases have occurred in many other countries at the same time. In Europe, between 1994 and 1999 the stock market valuations of France, Germany, Italy, Spain, and the United Kingdom roughly doubled. The stock market valuations of Canada, too, just about doubled, and those of Australia increased by half. In the course of 1999, stock markets in Asia (Hong Kong, Indonesia, Japan, Malaysia, Singapore, and South Korea) and Latin America (Brazil, Chile, and Mexico) have made spectacular gains. But no other country of comparable size has had so large an increase since 1994 as that seen in the United States.\ Price increases in single-family homes have also occurred over the same time, but significant increases have occurred in only a few cities. Between 1994 and 1999 the total average real price increase of homes in ten major U.S. cities was only 9%. These price increases are tiny relative to the increase in the U.S. stock market.1\ The extraordinary recent levels of U.S. stock prices, and associated expectations that these levels will be sustained or surpassed in the near future, present some important questions. We need to know whether the current period of high stock market pricing is like the other historical periods of high pricing, that is, whether it will be followed by poor or negative performance in coming years. We need to know confidently whether the increase that brought us here is indeed a speculative bubble—an unsustainable increase in prices brought on by investors' buying behavior rather than by genuine, fundamental information about value. In short, we need to know if the value investors have imputed to the market is not really there, so that we can readjust our planning and thinking.\ A Look at the Data\ Figure 1.1 Stock Prices and Earnings, 1871-2000 Real (inflation- corrected) S&P Composite Stock Price Index, monthly, January 1871 through January 2000 (upper series), and real S&P Composite earnings (lower series), January 1871 to September 1999. Source: Author's calculations using data from S&P Statistical Service; U.S. Bureau of Labor Statistics; Cowles and associates, Common Stock Indexes; and Warren and Pearson, Gold and Prices. See also note 2.\ Figure 1.1 shows, for the United States, the monthly real (corrected for inflation using the Consumer Price Index) Standard and Poor's (S&P) Composite Stock Price Index from January 1871 through January 2000 (upper curve), along with the corresponding series of real S&P Composite earnings (lower curve) for the same years.2 This figure allows us to get a truly long-term perspective on the U.S. stock market's recent levels. We can see how differently the market has behaved recently as compared with the past. We see that the market has been heading up fairly uniformly ever since it bottomed out in July 1982. It is clearly the most dramatic bull market in U.S. history. The spiking of prices in the years 1992 through 2000 has been most remarkable: the price index looks like a rocket taking off through the top of the chart! This largest stock market boom ever may be referred to as the millennium boom.3\ Yet this dramatic increase in prices since 1982 is not matched in real earnings growth. Looking at the figure, no such spike in earnings growth occurs in recent years. Earnings in fact seem to be oscillating around a slow, steady growth path that has persisted for over a century.\ No price action quite like this has ever happened before in U.S. stock market history. There was of course the famous stock run-up of the 1920s, culminating in the 1929 crash. Figure 1.1 reveals this boom as a cusp-shaped price pattern for those years. If one corrects for the market's smaller scale then, one recognizes that this episode in the 1920s does resemble somewhat the recent stock market increase, but it is the only historical episode that comes even close to being comparable to the present boom.\ There was also a dramatic run-up in the late 1950s and early 1960s, culminating in a flat period for half a decade that was followed by the 1973-74 stock market debacle. But the price increase during this boom was certainly less dramatic than today's.\ Price Relative to Earnings\ Part of the explanation for the remarkable price behavior between 1990 and 2000 may have to do with somewhat unusual earnings. Many observers have remarked that earnings growth in the five-year period ending in 1997 was extraordinary: real S&P Composite earnings more than doubled over this interval, and such a rapid five-year growth of real earnings has not occurred for nearly half a century. But 1992 marked the end of a recession during which earnings were temporarily depressed. Similar increases in earnings growth have happened before following periods of depressed earnings from recession or depression. In fact, there was more than a quadrupling of real earnings from 1921 to 1926 as the economy emerged from the severe recession of 1921 into the prosperous Roaring Twenties. Real earnings doubled during five-year periods following the depression of the 1890s, the Great Depression of the 1930s, and World War II.\ Figure 1.2 Price-Earnings Ratio, 1881-2000 Price-earnings ratio, monthly, January 1881 to January 2000. Numerator: real (inflation-corrected) S&P Composite Stock Price Index, January. Denominator: moving average over preceding ten years of real S&P Composite earnings. Years of peaks are indicated. Source: Author's calculations using data from sources given in Figure 1.1. See also note 2.\ Figure 1.2 shows the price-earnings ratio, that is, the real (inflation- corrected) S&P Composite Index divided by the ten-year moving average real earnings on the index. The dates shown are monthly, January 1881 to January 2000. The price-earnings ratio is a measure of how expensive the market is relative to an objective measure of the ability of corporations to earn profits. I use the ten-year average of real earnings for the denominator, along lines proposed by Benjamin Graham and David Dodd in 1934. The ten-year average smooths out such events as the temporary burst of earnings during World War I, the temporary decline in earnings during World War II, or the frequent boosts and declines that we see due to the business cycle.4 Note again that there is an enormous spike after 1997, when the ratio rises until it hits 44.3 by January 2000. Price-earnings ratios by this measure have never been so high. The closest parallel is September 1929, when the ratio hit 32.6.\ In the latest data on earnings, earnings are quite high in comparison with the Graham and Dodd measure of long-run earnings, but noth-ing here is startlingly out of the ordinary. What is extraordinary today is the behavior of price (as also seen in Figure 1.1), not earnings.\ Other Periods of High Price Relative to Earnings\ There have been three other times when the price-earnings ratio as shown in Figure 1.2 attained high values, though never as high as the 2000 value. The first time was in June 1901, when the price-earnings ratio reached a high of 25.2 (see Figure 1.2). This might be called the "Twentieth Century Peak," since it came around the time of the celebration of this century. (The advent of the twentieth century was celebrated on January 1, 1901, not January 1, 1900.)5 This peak occurred as the aftermath of a doubling of real earnings within five years, following the U.S. economy's emergence from the depression of the 1890s.6 The 1901 peak in the price-earnings ratio occurred after a sudden spike in the price-earnings ratio, which took place between July 1900 and June 1901, an increase of 43% within eleven months. A turn-of-the-century optimism, associated with expansion talk about a prosperous and high-tech future, appeared.\ After 1901, there was no pronounced immediate downtrend in real prices, but for the next decade prices bounced around or just below the 1901 level and then fell. By June 1920, the stock market had lost 67% of its June 1901 real value. The average real return in the stock market (including dividends) was 3.4% a year in the five years following June 1901, barely above the real interest rate. The average real return (including dividends) was 4.4% a year in the ten years following June 1901, 3.1% a year in the fifteen years following June 1901, and - 0.2% a year in the twenty years following June 1901.7 These are lower returns than we generally expect from the stock market, though had one held on into the 1920s, returns would have improved dramatically.\ The second instance of a high price-earnings ratio occurred in September 1929, the high point of the market in the 1920s and the second-highest ratio of all time. After the spectacular bull market of the 1920s, the ratio attained a value of 32.6. As we all know, the market tumbled from this high, with a real drop in the S&P Index of 80.6% by June 1932. The decline in real value was profound and long-lasting. The real S&P Composite Index did not return to its September 1929 value until December 1958. The average real return in the stock market (including dividends) was -13.1% a year for the five years following September 1929, -1.4% a year for the next ten years, -0.5% a year for the next fifteen years, and 0.4% a year for the next twenty years.8\ The third instance of a high price-earnings ratio occurred in January 1966, when the price-earnings ratio as shown in Figure 1.2 reached a local maximum of 24.1. We might call this the "Kennedy-Johnson Peak," drawing as it did on the prestige and charisma of President John Kennedy and the help of his vice-president and successor Lyndon Johnson. This peak came after a dramatic bull market and after a five-year price surge, from May 1960, of 46%. This surge, which took the price-earnings ratio to its local maximum, corresponded to a surge in earnings of 53%. The market reacted to this earnings growth as if it expected the growth to continue, but of course it did not. Real earnings increased little in the next decade. Real prices bounced around near their January 1966 peak, surpassing it somewhat in 1968 but then falling back, and real stock prices were down 56% from their January 1966 value by December 1974. Real stock prices would not be back up to the January 1966 level until May 1992. The average real return in the stock market (including dividends) was -2.6% a year for the five years following January 1966, -1.8% a year for the next ten years, -0.5% a year for the next fifteen years, and 1.9% a year for the next twenty years.\ A Historical Relation between Price-Earnings Ratios and Subsequent Long-Term Returns\ Figure 1.3 Price-Earnings Ratio as Predictor of Ten-Year Returns Scatter diagram of annualized ten-year returns against price-earnings ratios. Horizontal axis shows the price-earnings ratio (as plotted in Figure 1.2) for January of the year indicated, dropping the 19 from twentieth-century years and dropping the 18 from nineteenth-century years and adding an asterisk (*). Vertical axis shows the geometric average real annual return per year on investing in the S&P Composite Index in January of the year shown, reinvesting dividends, and selling ten years later. Source: Author's calculations using data from sources given in Figure 1.1. See also note 2.\ Figure 1.3 is a scatter diagram showing, for January of each year 1881 to 1989, on the horizontal axis, the price-earnings ratio for that month, and, on the vertical axis, the annualized real (inflation-corrected) stock market return over the ten years following that month. This scatter diagram allows us to see visually how well the price-earnings ratio forecasts subsequent long-term (ten- year) returns. Only January data are shown: if all twelve months of each year were shown there would be so many points that the scat-ter would be unreadable. The downside of this plotting method, of course, is that by showing only January data we miss most of the peaks and troughs of the market. For example, we miss the peak of the market in 1929 and also miss the negative returns that followed it. The price-earnings ratio shown in Figure 1.3 is the same as that plotted in Figure 1.2. Each year is indicated by the last two digits of the year number; years from the nineteenth century are indicated by an asterisk (*).\ Figure 1.3 shows how the price-earnings ratio has forecast returns, since each price-earnings ratio shown on the horizontal axis was known at the beginning of the ten-year period. This scatter diagram was developed by fellow economist John Campbell and me. Plots like it, for various countries, were the centerpiece of our testimony before the board of governors of the Federal Reserve on December 3, 1996.9\ The swarm of points in the scatter shows a definite tilt, sloping down from the upper left to the lower right. The scatter shows that in some years near the left of the scatter (such as January 1920, January 1949, or January 1982) subsequent long-term returns have been very high. In some years near the right of the scatter (such as January 1929, January 1937, or January 1966) subsequent returns have been very low. There are also some important exceptions, such as January 1899, which still managed to have subsequent ten-year returns as high as 5.5% a year despite a high price-earnings ratio of 22.9, and January 1922, which managed to have subsequent ten-year returns of only 8.7% a year despite a low price-earnings ratio of 7.4. But the point of this scatter diagram is that, as a rule and on average, years with low price-earnings ratios have been followed by high returns, and years with high price-earnings ratios have been followed by low or negative returns.\ The relation between price-earnings ratios and subsequent returns appears to be moderately strong, though there are questions about its statistical significance, since there are only about twelve nonoverlapping ten-year intervals in the 119 years' worth of data. There has been substantial academic debate about the statistical significance of relationships like this one, and some difficult questions of statistical methodology are still being addressed. We believe, however, that the relation should be regarded as statistically significant.10 Our confidence in the relation derives partly from the fact that analogous relations appear to hold for other countries and for individual stocks. Figure 1.3 confirms that long-term investors—investors who can commit their money to an investment for ten full years—do well when prices were low relative to earnings at the beginning of the ten years and do poorly when prices were high at the beginning of the ten years. Long-term investors would be well advised, individually, to stay mostly out of the market when it is high, as it is today, and get into the market when it is low.11\ The recent values of the price-earnings ratio, well over 40, are far outside the historical range of price-earnings ratios. If one were to locate such a price- earnings ratio on the horizontal axis, it would be off the chart altogether. It is a matter of judgment to say, from the data shown in Figure 1.3, what predicted return the relationship suggests over the succeeding ten years; the answer depends on whether one fits a straight line or a curve to the scatter, and since the 2000 price-earnings ratio is outside the historical range, the shape of the curve can matter a lot. Suffice it to say that the diagram suggests substantially negative returns, on average, for the next ten years.\ Part of the reason to suspect that the relation shown in Figure 1.3 is real is that, historically, when price was high relative to earnings as computed here (using a ten-year moving average of earnings), the return in terms of dividends has been low, and when price was low relative to earnings, the return in terms of dividends has been high.12 The recent record-high price-earnings ratios have been matched by record-low dividend yields. In January 2000, S&P dividends were 1.2% of price, far below the 4.7% that is the historical average. It is natural to suppose that when one is getting so much lower dividends from the shares one owns, one ought to expect to earn lower investing returns overall. The dividend is, after all, part of the total return one gets from holding stocks (the other part being the capital gain), and dividends historically represent the dominant part of the average return on stocks. The reliable return attributable to dividends, not the less predictable portion arising from capital gains, is the main reason why stocks have on average been such good investments historically.\ Returns from holding stocks must therefore be low when dividends are low—unless low dividends themselves are somehow predictors of stock market price increases, so that one can at times of low dividends actually expect stock price to rise more than usual to offset the effects of the low dividends on returns. As a matter of historical fact, times when dividends have been low relative to stock prices have not tended to be followed by higher stock price increases in the subsequent five or ten years. Quite to the contrary: times of low dividends relative to stock price in the stock market as a whole tend to be followed by price decreases (or smaller than usual increases) over long horizons, and so returns tend to take a double hit at such times, from both low dividend yields and price decreases. Thus the simple wisdom—that when one is not getting much in dividends relative to the price one pays for stocks it is not a good time to buy stocks—turns out to have been right historically.\ Worries about Irrational Exuberance\ The news media have tired of describing the high levels of the market, and discussion of it is usually omitted from considerations of market outlook. And yet, deep down, people know that the mar-ket is highly priced, and they are uncomfortable about this fact.\ Most people I meet, from all walks of life, are puzzled over the apparently high levels of the stock market. We are unsure whether the market levels make any sense, or whether they are indeed the result of some human tendency that might be called irrational exuberance. We are unsure whether the high levels of the stock market might reflect unjustified optimism, an optimism that might pervade our thinking and affect many of our life decisions. We are unsure what to make of any sudden market correction, wondering if the previous market psychology will return.\ Even Alan Greenspan seems unsure. He made his "irrational exuberance" speech two days after I had testified before him and the Federal Reserve Board that market levels were irrational, but a mere seven months later he reportedly took an optimistic "new era" position on the economy and the stock market. In fact, Greenspan has always been very cautious in his public statements, and he has not committed himself to either view. A modern version of the prophets who spoke in riddles, Greenspan likes to pose questions rather than make pronouncements. In the public exegesis of his remarks, it is often forgotten that, when it comes to such questions, even he does not know the answers.\ Shakespear's Brain\ Reading with Cognitive Theory\ \ \ By Mary Thomas Crane\ \ Princeton University Press\ Copyright © 2000 Princeton University Press. All rights reserved.\
1The stock market in historical perspective12The real estate market in historical perspective113Precipitating factors : the capitalist explosion, the internet, and other events314Amplification mechanisms : naturally occurring Ponzi processes565The news media856New era economic thinking1067New eras and bubbles around the world1328Psychological anchors for the market1479Herd behavior and epidemics15710Efficient markets, random walks, and bubbles17711Investor learning - and unlearning19512Speculative volatility in a free society207
\ From Barnes & NobleTaking his title from Alan Greenspan's 1996 cautionary phrase, Shiller demonstrates that the uniqueness of investors today make traditional economic interpretations obsolete. With the urgency of this morning's headlines, he warns that the herd behavior that triggered the market's recent roller-coaster dips and rises will continue to distort its mechanisms, and he advises reader-investors about actions that they can take or should avoid.\ \ \ \ \ Diane CoyleAs the share prices of dot.coms and high-tech companies fall to earth, you have to wonder whether the bubble is finally bursting. Yet many people still find it hard to shake the gut feeling that nothing should be allowed to spoil the party, even though the rational mind insists stock markets have been wildly overvalued. Robert Shiller, a highly respected professor of economics at Yale University in the US, offers in this timely book some food for the intellect to chew on. He points out that if the general level of share prices were to fall back to their mid-1990s level - a drop in the S&P 500 from about 1,400 to about 500 - the inflation-adjusted losses would be comparable to the destruction of all the farms, or all the homes in America.\ — Independent London\ \ \ David WarshThus it is an event of some significance that Shiller has written a crystal-clear and tough-minded critique of the factors that have driven US stock markets to their current levels and called his book Irrational Exuberance. In it, he argues that Federal Reserve chairman Alan Greenspan had it exactly right when he uttered the famous phrase in a speech in 1996. The current high levels of the market don't represent a consensus judgment by a cadre of sober experts, says Shiller. Instead, today's market is sky high because of wishful thinking by millions of people, egged on by professionals in and around Wall Street whose incentives all run in the direction of the more the merrier.\ —Boston Globe\ \ \ \ \ Robert J. SamuelsonAlan Greenspan faces long odds in trying to nudge the stock market to where he'd like it to go. The chairman of the Federal Reserve has argued that the buoyant market -- by making Americans feel so much wealthier -- has triggered a consumer spending spree that threatens inflationary wage pressures....The idea is to dampen spending and the ravenous appetite for stocks. Anyone who thinks this will be easy should read Irrational Exuberance, a new book by Yale University economist Robert J. Shiller. Beyond arguing that the present market is a "speculative bubble," Shiller contends that investor psychology is so given to herd behavior that it's almost impossible to manipulate or even influence. The market can "go through significant mispricing lasting years or even decades."\ — Washington Post\ \ \ \ \ John CassidyDuring the past decade, he has emerged as a leader in the new field of "behavioral finance" which seeks to apply lessons learned from other academic disciplines, particularly psychology to economics. Irrational Exuberance is not just a prophecy of doom. Encompassing history, sociology, and biology, as well as psychology and economics, it is a serious attempt to explain how speculative bubbles come about and how they sustain themselves.\ —New Yorker\ \ \ \ \ Burton G. MalkielIrrational Exuberance presents a message investors would be wise to heed: Make sure your portfolio is adequately diversified. Save more and don't count on the double-digit gains of the past decades continuing to bail you out during retirement. Mr. Shiller's book offers a dose of realism and is a great read.\ — Wall Street Journal\ \ \ \ \ Joanne GrayThe stockmarket's most prominent bull, Goldman Sachs analyst Ms Abby Joseph Cohen, and Professor Robert Shiller , a scholar who argues that the market's levels are based on overconfidence, agree on at least one issue: market psychology is as much a determinant of share prices as underlying fundamentals.\ — Australian Finance Review\ \ \ \ \ Library JournalShiller (economics, Yale Univ.) has updated his landmark 2000 study of U.S. stock market psychology. In that work, he amassed research from market peaks in 1929 and 1966 to warn that the same factors were present in the 2000 market. He further explained that past bull markets fed upon themselves to go beyond what the facts justified and that the 2000 market was a speculative bubble awaiting correction. In the new edition, Shiller builds on his original research by including 2000 as a third major peak.The second edition's new component, then, is Shiller's exploration of how market psychology has responded to the ensuing five years of retrenchment. One chilling conclusion he reaches from his knowledge of past market performance is that the 2005 market may still be correcting and that a return to 2000 levels may be a decade away. He further warns that many investors are still too heavily invested in equities and that proposals to invest Social Security funds in the stock market would subject the retirement system to unacceptable risk. Shiller expands his focus to include the booming real estate market, where he sees another speculative bubble building. Shiller's lucid work is essential for all academic and public libraries.-Lawrence R. Maxted, Gannon Univ., Erie, PA Copyright 2005 Reed Business Information.\ \ \ \ \ BooknewsIn light of Federal Reserve chairman Greenspan's famous reference to the volatile stock market's "irrational exuberance," a Yale U. economics professor challenges investors and policymakers to think beyond the market efficiency model to fathom the "new era economy." The hardcover edition (Princeton U. Press, 2000) was a bestseller. Annotation c. Book News, Inc., Portland, OR (booknews.com)\ \ \ \ \ Alfred H. KingonShiller and his fellow doomsayers believe that the current market boom, in other words madness, has created a bubble - indeed the biggest bubble of them all - and will be followed soon by at least long-term stagnation if not outright devastation. It is not that there is no real basis for optimism, the learned sceptics agree, with technology breakthroughs fundamentally transforming our economy, but the Wall Street hype has transformed rational optimism to market lunacy, or, in polite and now overused terms, "irrational exuberance".\ —Financial Times\ \ \ \ \ William Wolmandazzling, richly textured, provocative...It is by far the most important book about the stock market since Jeremy J. Siegel's 1994 Stocks for the Long Run, offering a cogent statement of the bears' view of events to come.--Business Week\ \
