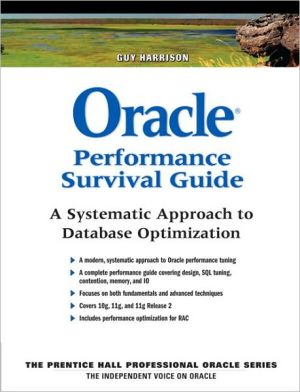
Oracle Performance Survival Guide: A Systematic Approach to Database Optimization
Oracle Performance Survival Guide\ A Systematic Approach to Database Optimization\ The fast, complete, start-to-finish guide to optimizing Oracle performance\ Oracle Performance Survival Guide offers a structured, systematic, start-to-finish methodology for optimizing Oracle performance as efficiently as possible. Leading Oracle expert Guy Harrison shows how to maximize your tuning investment by focusing on causes rather than symptoms, and by quickly identifying the areas that deliver the...
Search in google:
Oracle Performance Survival GuideA Systematic Approach to Database OptimizationThe fast, complete, start-to-finish guide to optimizing Oracle performanceOracle Performance Survival Guide offers a structured, systematic, start-to-finish methodology for optimizing Oracle performance as efficiently as possible. Leading Oracle expert Guy Harrison shows how to maximize your tuning investment by focusing on causes rather than symptoms, and by quickly identifying the areas that deliver the greatest “bang for the buck.”Writing for DBAs and developers with all levels of experience, Harrison covers every area of Oracle performance management, from application design through SQL tuning, contention management through memory and physical IO management. He also presents up-to-the-minute guidance for optimizing the performance of the Oracle 11g Release 2.You’ll start by mastering Oracle structured performance tuning principles and tools, including techniques for tracing and monitoring Oracle execution. Harrison illuminates the interaction between applications and databases, guides you through choosing tuning tools, and introduces upfront design techniques that lead to higher-performance applications. He also presents a collection of downloadable scripts for reporting on all aspects of database performance.Coverage includes• “Tuning by layers,” the most effective, highest-value approach to Oracle performance optimization• Making the most of Oracle’s core tools for tracing, monitoring, and diagnosing performance• Highly efficient database logical and physical design, indexing, transaction design, and API use• SQL and PL/SQL tuning, including the use of parallel SQL techniques• Minimizing contention for locks, latches, shared memory, and other database resources• Optimizing memory and physical disk IO• Tuning Real Application Cluster (RAC) databasesguyharrison.netinformit.com/ph
PrefacePart I: Methods, Concepts, and ToolsChapter 1. Oracle Performance Tuning: A Methodical ApproachA Brief History of Oracle Performance TuningMoving Beyond a Symptomatic ApproachStage 1: Minimizing the Application WorkloadStage 2: Reducing Contention and BottlenecksStage 3: Reducing Physical IOStage 4: Optimizing Disk IOSummaryChapter 2. Oracle Architecture and ConceptsThe Oracle APIsCreating the CursorChecking for Cached SQL StatementsParsing the SQLAssociating Bind VariablesExecuting the SQLFetching RowsUsing Array FetchProcessing Result SetsClosing the CursorOptimizing Oracle API CallsThe Oracle Query OptimizerCost Based OptimizationOptimizer GoalOptimizer StatisticsBind Variable Peeking and Adaptive Cursor SharingHintsOutlines, Profiles, and BaselinesTransactions and LockingOracle Server ArchitectureInstances and DatabasesThe System Global AreaData CachingThe Program Global AreaMemory ManagementSegments and FilesTablesIndexesBlocks, Extents, Segments, and PartitionsTablespaces and Data FilesUndo SegmentsRedo Logs and Archive LogsFlashback LogsServer ProcessesBackground ProcessesReal Application ClustersSummaryChapter 3. Tools of the TradeExplaining SQL StatementsThe Plan TableExploiting Cached SQLDBMS_XPLANInterpreting the Execution PlanVirtual IndexingTracing Oracle ExecutionTracing from Within Your SessionIdentifying Your Trace FileGetting Tracing StatusInvoking Trace in Another SessionTracing by MODULE, ACTION, or SERVICEStarting a Trace Using a Login TriggerFinding the Trace FileOther Specialized TracesFormatting Traces with tkprofThe tkprof Sort OptionsOther tkprof OptionsMerging Multiple SQL Trace FilesInterpreting Tkprof OutputExecution Plans in tkprofWait Statistics and tkprofAlternatives to tkprofUsing AUTOTRACE in SQL*PLUSMonitoring the Oracle ServerThe V$ table interfaceWait InterfaceThe Time ModelIntegrating the Time Model and Wait InterfaceOracle Enterprise ManagerSpotlight on OracleSummaryPart II: Application and Database DesignChapter 4. Logical and Physical Database DesignLogical Data ModelingNormalization and Third Normal FormData Type ChoicesArtificial KeysData Warehouse DesignLogical to PhysicalMapping Entities or Classes to TablesChoosing a Table TypeData Types and PrecisionsOptional Attributes and NULL ValuesColumn OrderExploiting Oracle Object TypesDenormalizationReplicating Column Values to Avoid JoinsSummary TablesVertical PartitioningImplementing DenormalizationStar Schema DesignStar Schema BasicsSnowflakes SchemasDimension HierarchiesAggregations and Materialized ViewsMaterialized View Best PracticesPhysical Storage OptionsManual and Automatic Segment Storage ManagementConcurrent Inserts and FreelistsPCTFREE and PCTUSEDCompressionLOB StorageOracle PartitioningTypes of PartitionsComposite PartitionsChoosing a Partitioning StrategyEnterprise Manager Partitioning AdvisorSummaryChapter 5. Indexing and ClusteringOverview of Oracle Indexing and ClusteringB*-Tree IndexesIndex SelectivityUnique IndexesImplicit IndexesConcatenated IndexesIndex Skip ScansGuidelines for Concatenated IndexesIndex MergesNull Values in IndexesReverse Key IndexesIndex CompressionFunctional IndexesForeign Keys and LockingIndexes and PartitioningBitmap IndexesFeatures of Bitmap IndexesDrawbacks of Bitmap IndexesBitmap Indexes and CardinalityBitmap Index MergeBitmap Join IndexesIndex OverheadIndex Organized TablesConfiguring the Overflow SegmentPeriodic Rebuild of Index Only TablesClusteringIndex ClustersHash ClustersNested TablesChoosing the Best Indexing StrategySummaryChapter 6. Application Design and ImplementationSQL Statement ManagementOptimizing ParsingAvoiding Unnecessary SQL ExecutionsThe Array InterfaceImplementing Array FetchArray InsertTransaction DesignIsolation LevelsTransactions and LocksRow Level Locking in OracleApplication Locking StrategiesUsing Stored Procedures to Reduce Network TrafficSummaryPart III: SQL and PL/SQL TuningChapter 7. Optimizing the OptimizerThe Oracle OptimizerWhat Is Cost?Optimizer GoalSelectivity and CardinalityQuery TransformationCost CalculationsObject StatisticsHistogramsBind Variable PeekingAdaptive Cursor SharingDatabase ParametersSystem StatisticsCollecting StatisticsUsing DBMS_STATDBMS_STATS Procedures and ParametersSetting DBMS_STATS DefaultsCreating Histograms with METHOD_OPTSamplingPartition StatisticsExtended StatisticsLocking StatisticsSystem StatisticsExporting and Importing StatisticsManipulating StatisticsSummaryChapter 8. Execution Plan ManagementHintsUsing Hints to Change the Access PathUsing Hints to Change the Join OrderErrors in Hint SpecificationsStored OutlinesCreating an Outline to Stabilize a PlanHacking an OutlineSQL Tuning SetsManually Creating a Tuning SetCreating Tuning Sets inEnterprise ManagerSQL Profiles and the SQL Tuning AdvisorUsing DBMS_SQLTUNEIndexing AdviceSQL Tuning in Enterprise ManagerCross-SQL Tuning with the SQL Access AdvisorSQL BaselinesCreating the BaselineEvolving the BaselineAutomating and Configuring BaselinesFixed BaselinesBaseline Management in OracleEnterprise ManagerSummaryChapter 9. Tuning Table AccessSingle Value LookupsChoosing Between Table and Index ScanBitmap Indexes and Single Value LookupsHash Clusters and Single Value LookupsAvoiding “Accidental” Table ScansNOT EQUALS ConditionsSearching for NullsSearching for Values That Are NOT NULLCreating Indexes on NULLable ColumnsUnintentionally Disabling an Index with a FunctionFunctional IndexesFunctional Indexes and StatisticsVirtual ColumnsMulticolumn LookupsUsing Concatenated IndexesIndex MergesUniqueness and Over-IndexingSearching for RangesUnbounded Range ScanBounded Range ScansRange LookupsUsing the LIKE OperatorMultvalue Single-Column LookupsOptimizing Necessary Full Table ScansLowering the High Water MarkOptimizing PCTFREE and PCTUSEDReducing the Row LengthCompressing the TableMaking Database IO More EfficientUsing the SAMPLE OptionParallel QueryThe Fast Full Index ScanPartitioningSummaryChapter 10. Joins and SubqueriesTypes of JoinsJoin MethodsNested Loops JoinSort-Merge JoinHash JoinChoosing the Right Join MethodSort-Merge/Hash Versus Nested LoopsSort-Merge Versus Hash JoinsOptimizing JoinsOptimizing Nested Loops JoinOptimizing Sort-Merge and Hash JoinsAvoiding JoinsDenormalizationIndex ClustersMaterialized ViewsBitmap Join IndexJoin Order Special JoinsOuter JoinsStar JoinsHierarchical JoinsSubqueriesSimple SubqueriesCorrelated SubqueriesAnti-Join SubqueriesSemi-Join SubqueriesSummaryChapter 11. Sorting, Grouping, and Set OperationsSort OperationsOptimal, One-Pass and Multi-Pass SortsMeasuring Sort ActivityTracing Sort ActivityUsing an Index to Avoid a SortGrouping and AggregatesAggregate OperationsMaximums and MinimumsThe “Top N” QueryCounting the Rows in a TableGROUP BY OperationsHAVING Versus WHERESET OperationsUNION Versus UNION ALLINTERSECTMINUSSET Operations and Their AlternativesSummaryChapter 12. Using and Tuning PL/SQLPerformance Advantages of PL/SQLA Procedural ApproachReduction in Network OverheadDivide and Conquer Massive SQLsMeasuring PL/SQL PerformanceMeasuring PL/SQL OverheadUsing DBMS_PROFILERThe 11g Hierarchical ProfilerData Access OptimizationArray Processing and BULK COLLECTArray Processing for INSERT StatementsBind Variables and Dynamic SQLPL/SQL Code OptimizationTune the SQL FirstPLSQL_OPTIMIZE_LEVELLOOP Optimization“Short Circuiting” ExpressionsOrder of Expressions in IF and CASE StatementsRecursionThe NOCOPY ClauseAssociative ArraysOther OptimizationsNative CompilationPL/SQL In-LiningData TypesUsing Java for ComputationFunction CachingDML Trigger PerformanceUPDATE OF and WHEN ClausesBefore and After Row TriggersSummaryChapter 13. Parallel SQLUnderstanding Parallel SQLParallel Processes and the Degree of ParallelismParallel Slave PoolParallel Query IOParallel Performance GainsDeciding When to Use Parallel ProcessingYour Server Computer Has Multiple CPUsThe Data to Be Accessed Is on Multiple Disk DrivesThe SQL to Be Parallelized is Long Running or Resource-IntensiveThe SQL Performs at Least One Full Table, Index, or Partition ScanThere Is Spare Capacity on Your HostThe SQL is Well TunedConfiguring Parallel ProcessingDetermining the Degree of ParallelismParallel HintsParallel Configuration ParametersMonitoring Parallel SQLParallel Explain PlansTracing Parallel ExecutionThe V$PQ_TQSTAT ViewOther StatisticsOptimizing Parallel PerformanceStart with a SQL That Is Optimized for Serial ExecutionEnsure That the SQL Is a Suitable SQL for Parallel ExecutionEnsure That the System Is Suitably Configured for Parallel ExecutionMake Sure that All Parts of the Execution Plan Are ParallelizedEnsure That the Requested DOP Is RealisticMonitor the Actual DOPCheck for Skew in Data and Skew in Workload Between ProcessesOther Parallel TopicsParallel Execution in RACParallel Index LookupsParallel DMLParallel DDLSummaryChapter 14. DML TuningDML Performance FundamentalsWHERE Clause OptimizationIndex OverheadTrigger OverheadReferential IntegrityINSERT Specific OptimizationsArray ProcessingDirect Path InsertsMulti-Table InsertManual Segment Storage Management (MSSM) and FreelistsParallel DMLDELETE OperationsTRUNCATEPartitionsCreate Table as SelectUPDATE and MERGE OperationsCorrelated UPDATEsOptimizing MERGECOMMIT OptimizationCOMMIT FrequencyBatch and NOWAIT CommitNOLOGGINGSummaryPart IV: Minimizing ContentionChapter 15. Lock ContentionLock Types and ModesWaiting for LocksMonitoring and Analyzing LocksLock Wait StatisticsFinding the Responsible SQLMeasuring Lock Contention for Specific TransactionsTracing Lock ActivityBlockers and WaitersApplication Locking StrategiesWhen Row Level Locking FailsUnindexed Foreign KeysITL WaitsBitmap IndexesDirect Path InsertsSystem LocksThe High Water Mark (HW) EnqueueThe Space Transaction (ST) EnqueueThe Sequence Cache (SQ) EnqueueThe User Lock (UL) EnqueueOther System LocksSummaryChapter 16. Latch and Mutex ContentionOverview of Latch and Mutex ArchitectureGets, Spins, and SleepsMutexesMeasuring and Diagnosing Latch/Mutex ContentionIdentifying Individual LatchesFinding SQLs and Segments Associated with Latch WaitsSpecific Latch/Mutex ScenariosLibrary Cache Mutex WaitsLibrary Cache PinShared Pool LatchCache Buffers Chains LatchRow Cache Objects LatchOther Latch ScenariosIs Latch Contention Inevitable?What About Changing _SPIN_COUNT?Spin Count, Latch Contention, and ThroughputSetting Spin Count for Individual LatchesSummaryChapter 17. Shared Memory ContentionBuffer Cache ArchitectureFree Buffer WaitsDBWR Direct and Asynchronous IOOther Remedies for Free Buffer WaitsRecovery Writer (RVWR) WaitsImproving Flashback Log IOIncreasing the Size of theFlashback Log BufferBuffer Busy WaitsMeasuring Buffer BusyTraditional Causes of Buffer Busy WaitsBuffer Busy and Hot BlocksRedo Log Buffer WaitsSummaryPart V: Optimizing MemoryChapter 18. Buffer Cache TuningBuffer Cache PrinciplesThe LRU ListTable Scan HandlingThe CACHE PropertyDirect Path IOBuffer Cache Configuration and TuningMonitoring the Buffer CacheThe Buffer Cache Hit RateMultiple Buffer CachesSizing the Buffer CacheAutomatic Shared Memory Management (ASMM)Implementing ASMMMonitoring Resize OperationsTuning ASMMNondefault PoolsMemory ThrashingSummaryChapter 19. Optimizing PGA MemoryIO and PGA MemoryPGA Memory ManagementPGA_AGGREGATE_TARGETSession PGA LimitsMeasuring PGA Usage and EfficiencySession PGA UtilizationMeasuring Temporary IO Wait TimeMeasuring Work Area ActivitySizing the PGA with V$PGA_TARGET_ADVICEOver-Riding PGA Aggregate TargetSummaryChapter 20. Other Memory Management TopicsOptimizing Overall Oracle MemoryIO Wait Times and Memory OptimizationUsing Advisories to Distribute PGA/Buffer Cache MemoryOracle 11G Automatic Memory Management (AMM)Result Set CacheEnabling and Configuring the Result Set CacheResult Cache StatisticsResult Cache DependenciesResult Cache LatchesPL/SQL Function CacheOther Memory OptimizationsSizing the Shared PoolLarge Pool SizingRedo Log BufferLocking the SGASummaryPart VI: IO Tuning and ClusteringChapter 21. Disk IO Tuning FundamentalsDisk IO ConceptsService Time and ThroughputQueuingDisk Drives: Slow and Getting SlowerDisk Capacity and Data PlacementOracle IO ArchitectureDatafile Single Block ReadMulti Block ReadDirect Path ReadsTemporary Direct Path IOData File Write IODirect Path WritesRedo Log IOArchive Log IOFlashback IOControl File IOMeasuring and Monitoring Oracle IOIO Wait TimesMonitoring Datafile IOCalibrating IOOptimizing Datafile IOMinimizing IO LatencyMaximizing IO ThroughputStriping StrategiesRAID ArraysIsolating Datafile IORedo and Archive OptimizationAlternating and Distributing LogsRedo and Archive Fine-Grained StripingJust Say NO to RAID5 for Redo!Redo Log SizingFlashback LogsSummaryChapter 22. Advanced IO TechniquesAutomatic Storage Management (ASM)ASM ArchitectureASM MonitoringASM TuningSolid State Disk (SSD)Flash-Based SSDDDR RAM-Based SSDHybrid SSDUsing SSD for Oracle DatabasesThe Exadata Storage ServerDatabase Block SizeSummaryChapter 23. Optimizing RACRAC OverviewGlobal Cache RequestsRAC Tuning PrinciplesSingle Instance Tuning and RACMeasuring Cluster OverheadReducing Global Cache LatencyMeasuring Global Cache LatencyExamining the InterconnectSigns of Interconnect ProblemsOptimizing the InterconnectNetwork Hardware and ProtocolsEthernet Jumbo FramesUDP Buffer SizeLMS WaitsCluster BalanceAssessing Cluster BalanceCluster Balance and ServicesRAC Load Balancing FacilitiesMinimizing Global Cache RequestsCauses of High Global Cache Request RatesMeasuring Global Cache Request RatesTechniques for Reducing Global Cache RequestsSummaryBibliography9780137011957 TOC 9/21/2009




![SQL Queries for Mere Mortals: A Hands-on Guide to Data Manipulation in SQL [For Mere Mortals Series] SQL Queries for Mere Mortals: A Hands-on Guide to Data Manipulation in SQL [For Mere Mortals Series]](/application/data/covers/44/31/9780321444431.jpg)
