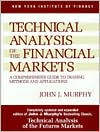
Technical Analysis of the Financial Markets: A Comprehensive Guide to Trading Methods and Applications
"One way to get started in technical analysis is to read a good book on the subject. One of my favorites is Technical Analysis of the Financial Markets: A Comprehensive Guide to Trading Methods and Applications by John J. Murphy. It's an easy read." \ -Ralph J. Acampora, CMT, Managing Director, Prudential Securities Inc.\ \ "No one in this generation has contributed more to technical analysis than John Murphy. Through his series of books, he has both opened the door to many and raised the...
Search in google:
"One way to get started in technical analysis is to read a good book on the subject. One of my favorites is Technical Analysis of the Financial Markets: A Comprehensive Guide to Trading Methods and Applications by John J. Murphy. It's an easy read." -Ralph J. Acampora, CMT, Managing Director, Prudential Securities Inc. "No one in this generation has contributed more to technical analysis than John Murphy. Through his series of books, he has both opened the door to many and raised the standard for all who use technical analysis. His book should be required reading for everyone in the securities business and are never more than a step away from my desk." -Gail M. Dudack, Chief Investment Strategist, Warburg Dillon Read "John Murphy appears to have done it again...only this time in a more contemporary fashion. Technical Analysis of the Financial Markets is a must read for the novice and the professional and most important the Chartered Market Technician (C.M.T.) candidate. As a long-time point-and-figure chart devotee, I was enthused to see the book's point-and-figure chapter no only cover some of the more popular methods such as Chartcraft and Dorsey Wright, but also explore the usefulness of the original point-and-figure methodology which we practice here at Salomon Smith Barney" -Alan R. Shaw, Managing Director, Salomon Smith Barney Technical Analysis of the Financial Markets expands upon and updates Murphy's classic Technical Analysis of the Futures Markets. Packed with some 400 real-life charts that clarify every key point, it covers: -The fundamentals of technical analysis and chart construction -What you must know about trends and the building blocks of chart analysis -Price patterns, including major reversal and continuation patterns -Methods of analysis--moving averages, oscillators, contrary opinion, and other indicators -Time cycles, market interrelationships, money management, and trading tactics Beginners and experienced traders alike will find a wealth of immediately useful information in this authoritative, yet easy-to-follow guide. In the late 1980s, John J. Murphy's massive Technical Analysis of the Futures Markets created an uproar when it burst upon the scene. The most comprehensive, yet easy-to-follow guide to the concepts of technical analysis and their application to the futures markets, it swiftly became a classic--cited in research studies by the Federal Reserve and used as a primary source in the Market Technicians Association testing program. Today, it is widely considered the bible in its field. In response to widespread demand, John Murphy has completely updated and revised this landmark volume, broadened its scope, and expanded it to cover all financial markets. While it retains the clarity, simplicity, and logical structure that made the earlier book so popular, Technical Analysis of the Financial Markets thoroughly covers all the new techniques in charts and charting and the many recent developments in this fast-changing field. Every chapter has been updated. There is new emphasis on the stock market, hundreds of up-to-date illustrations, and three completely new chapters featuring extensive information on: Stock market indicators--advancing versus declining issues, new highs versus new lows, up volume versus down volume, and other tools to gauge market breadth and provide early warning of potential trend changes. Candlestick charting--how to best use these fascinating, visually appealing charts that deliver data with such impact it seems to literally jump off the page or computer screen. Intermarket analysis--a much-needed clear explanation of the vital interrelationships between the various financial markets In addition, the guide provides extensive new sections covering systems development, advanced technical indicators, and such newer forms of charting as market profiling. An invaluable tool for traders of all levels of experience, Technical Analysis of the Financial Markets guides you from the first application of the Dow Theory and the basics of charting through the latest computer technology and most advanced analysis systems.
About the AuthorAbout the ContributorsIntroductionAcknowledgments1Philosophy of Technical Analysis12Dow Theory233Chart Construction354Basic Concepts of Trend495Major Reversal Patterns996Continuation Patterns1297Volume and Open Interest1578Long Term Charts1819Moving Averages19510Oscillators and Contrary Opinion22511Point and Figure Charting26512Japanese Candlesticks29713Elliott Wave Theory31914Time Cycles34315Computers and Trading Systems37716Money Management and Trading Tactics39317The Link Between Stocks and Futures: Intermarket Analysis41318Stock Market Indicators43319Pulling It All Together - A Checklist453AAdvanced Technical Indicators463BMarket Profile475CThe Essentials of Building a Trading System493DContinuous Futures Contracts505Glossary511Selected Bibliography523Selected Resources527Index531
