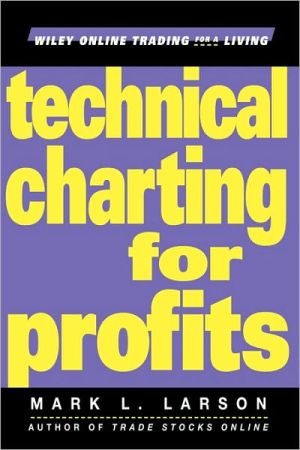
Technical Charting for Profits
An introduction to technical analysis with a free software and data offer from one of the top names in the business\ This indispensable book will guide traders and individual investors through the most important-and profitable-advances in today's investment arena. Technical Charting for Profits explains technical analysis topics to traders in an accessible manner, and covers how to apply them in actual trading practice. Filled with helpful sample charts, graphs, and end-of-chapter quizzes,...
Search in google:
Technical analysis-the reading of price and volume charts-is the preferred method of analysis for traders of all time frames. Technical analysis allows investors to view a stock's past performance, as well as present and future patterns, resulting in a vastly improved sense of a stock's direction. Such knowledge also frees investors from dependence on professional money managers and brokerage firms-not to mention their fees. In this book, seasoned investment educator and author Mark Larson explains advanced technical analysis topics in an accessible manner, and covers how to apply them in actual trading for both bullish and bearish market conditions.Utilizing charting patterns and indicators dramatically increases your ability to profit from the market by allowing you to make informed choices and decisions on such matters as timing, diversification, when to hold long-term-and when to cash out-particularly important in today's volatile climate.Uniting theory with practice, Larson uses examples from TC2000(r), the most widely distributed charting software package in the industry, to teach you the basics of understanding and using indicators. The ideal introduction to technical analysis, this book includes a CD-ROM video and a free month of TC2000(r).com.Technical Charting for Profits also provides you with an indispensable overview of the history of the stock market, plus helpful quizzes at the end of each chapter. Now you can take advantage of the great changes made by technology-by learning how to utilize them. Booknews This book/CD-ROM package explains advanced technical analysis (the reading of price and volume charts) in an accessible manner, and shows traders and individual investors how to apply them in actual trading for both bullish and bearish market conditions. Includes an overview of the history of the stock market, plus chapter quizzes. Examples are taken from TC2000, the most widely distributed charting software package, to teach how to understand and use indicators. The CD-ROM contains a video and a 30-day trial version of TC2000. Larson is founder of an investment firm. Annotation c. Book News, Inc., Portland, OR (booknews.com)
Note: The Figures and/or Tables mentioned in this chapter do not appear on the web.\ \ chapter 1\ planning your profits
Ch. 1planning your profits1Ch. 2Wall Street as it began13Ch. 3Support and Resistance Levels23Ch. 4Relative Strength43Ch. 5Balance of Power55Ch. 6Moving Averages67Ch. 7MoneyStream79Ch. 8Time Segmented Volume85Ch. 9additional indicators111Ch. 10technical corrections129Ch. 11optional profit$159Ch. 12put plays179Ch. 13investment structuring211glossary228index240
\ BooknewsThis book/CD-ROM package explains advanced technical analysis (the reading of price and volume charts) in an accessible manner, and shows traders and individual investors how to apply them in actual trading for both bullish and bearish market conditions. Includes an overview of the history of the stock market, plus chapter quizzes. Examples are taken from TC2000, the most widely distributed charting software package, to teach how to understand and use indicators. The CD-ROM contains a video and a 30-day trial version of TC2000. Larson is founder of an investment firm. Annotation c. Book News, Inc., Portland, OR (booknews.com)\ \
