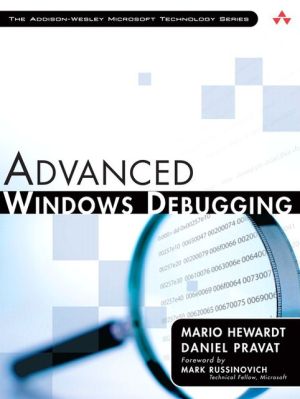
Advanced Windows Debugging [Addison-Wesley Microsoft Technology Series]
-- Bob Wilton, Escalation Engineer, Critical Problem Resolution Team, Microsoft\ “An excellent reference for both intermediate and advanced debuggers: highly practical, and filled with tricks and strategies. This book stands out from all other Win32 debugging literature, thanks to its in-depth examples–including resolving intricate problems like stack and heap corruptions.”\ -- Kinshuman, Development Lead, Windows Core OS Division, Microsoft\ The First In-Depth, Real-World, Insider’s Guide to...
Search in google:
— Bob Wilton, Escalation Engineer, Critical Problem Resolution Team, Microsoft“An excellent reference for both intermediate and advanced debuggers: highly practical, and filled with tricks and strategies. This book stands out from all other Win32 debugging literature, thanks to its in-depth examples–including resolving intricate problems like stack and heap corruptions.”— Kinshuman, Development Lead, Windows Core OS Division, MicrosoftThe First In-Depth, Real-World, Insider’s Guide to Powerful Windows DebuggingFor Windows developers, few tasks are more challenging than debugging–-or more crucial. Reliable and realistic information about Windows debugging has always been scarce. Now, with over 15 years of experience two of Microsoft’s system-level developers present a thorough and practical guide to Windows debugging ever written.Mario Hewardt and Daniel Pravat cover debugging throughout the entire application lifecycle and show how to make the most of the tools currently available–-including Microsoft’s powerful native debuggers and third-party solutions.To help you find real solutions fast, this book is organized around real-world debugging scenarios. Hewardt and Pravat use detailed code examples to illuminate the complex debugging challenges professional developers actually face. From core Windows operating system concepts to security, Windows® Vista™ and 64-bit debugging, they address emerging topics head-on–and nothing is ever oversimplified or glossed over!This book enables you to Master today’s most powerful Windows debugging tools, including NTSD, CDB, WinDbg, KD, and ADPlus Debug code that wasn’t designed or written for easy debugging Understand debuggers “under the hood,” and manage symbols and sources efficiently Debug complex memory corruptions related to stacks and heaps Resolve complex security problems Debug across processes: identity tracking, RPC debugger extensions, and tracking IPCs with Ethereal Find and fix resource leaks, such as memory and handle leaks. Debug common thread synchronization problems Learn when and how to write custom debugger extensions Perform “postmortem debugging” using crash dumps and Windows Error Reporting Automate debugging with DebugDiag and the Analyze Debugger commandWhether you’re a system-level or application developer, Advanced Windows Debugging delivers the deep understanding of debugging that could save you weeks on your very next project.Part I OverviewChapter 1 Introduction to the ToolsChapter 2 Introduction to the DebuggersChapter 3 Debugger UncoveredChapter 4 Managing Symbol and Source FilesPart II Applied DebuggingChapter 5 Memory Corruptions Part I – StacksChapter 6 Memory Corruptions Part I – HeapsChapter 7 SecurityChapter 8 Inter-process CommunicationChapter 9 Resource LeaksChapter 10 SynchronizationPart III Advanced TopicsChapter 11 Writing Custom Debugger ExtensionsChapter 12 64-bit DebuggingChapter 13 Postmortem DebuggingChapter 14 Power ToolsChapter 15 Windows Vista FundamentalsAppendix A Application Verifier Test SettingsIf you like Advanced Windows Debugging, keep an eye out for ADVANCED .NET DEBUGGING COMING IN NOV. 2009.
Preface\ Not long ago we, were reminiscing about a really tough problem we faced at work. The Quality Assurance team was running stress tests on our product and every four or five days, a crash would rear its ugly head. Sure, we had debugged the crash as far as we thought possible, and we had done extensive code reviews to try to figure it out, but alas, not enough information could be gained to get to the bottom of it. After several weeks of unfruitful attempts, we started looking for alternative approaches. During a random hallway conversation, someone happened to casually mention a tool called gflags. Having never heard of this tool before, we set out to do some research to find out how it could help us get to the bottom of our crash. Unfortunately, the learning process proved to be somewhat difficult. First, finding information about the tool proved to be a real challenge. There was a ton of great information in the reference documentation that came with the tools, but it was hard to figure out how to actually get started. We quickly realized that without some basic guidance, there was little hope for us to be able to utilize the tool. Naturally, we decided to ask the person who had happened to mention the tool if they knew of any documentation or pointers. They gave us some brief descriptions of the tool and, perhaps more importantly, the names of other people who had worked with the tools extensively. What followed was a series of long and instructive conversations, and bit by bit the basic idea behind the tools started falling into place.\ Did we ever get to the bottom of the crash? Yes—we did. As a matter of fact, enabling the correct tool while running our stress tests pinpointed the problem to such accuracy that it only took an hour of code reviewing to locate and fix the misbehaving code. Had we known about this tool and how to use it from the start we would have saved several weeks of work. From that point on, we dedicated quite a lot of time to furthering our understanding of the tools and how they can help while trying to troubleshoot misbehaving code.\ Over the years, the Windows debuggers and tools have matured and grown and become increasingly powerful. The amount of timesaving features now available is truly mind-boggling. What is equally mind-boggling is that after several years, the native debuggers and tools are still relatively unknown to developers. The few developers who do find out that these tools exist have to go through a similarly painful learning process as we did years ago. We were fortunate to have the luxury of working with engineers at Microsoft (some of whom wrote the tools), but without this luxury, many hopeful developers end up at a dead end and are never able to reap the benefits of the tools. This unfortunate problem of a lack of learning material also turned out to be a great opportunity for a solution, and thus the idea for this book was born. The key to enable developers to gain the knowledge required is to provide a central repository of concise information that fully explains the ins and outs of the debugging tools and processes. The book you are holding serves as that key and is the net result of three years of writing and over 10 years of collective debugging experience.\ We hope that you will enjoy reading this book as much as we enjoyed authoring it and that it will open up the door to a truly amazing world of highly efficient software troubleshooting and debugging. Knowing how to use the tools and techniques described in this book is a critical part of a computer scientist's work and can teach you how to very efficiently troubleshoot some of the toughest problems in software.\ Who Is This Book For?\ The short answer to this question is anyone who is involved in any facet of software development and has a strong desire to learn what is actually happening deep inside Windows. Although the technical nature of the book might make you believe that its content is only intended for advanced system engineers, this is absolutely not true. One of the key points of this book is the removing of the magic. For various reasons, a lot of software engineers believe that there is a magical relationship between the software they are working on and the operating system. When a problem surfaces that requires the analysis of operating system components (such as RPC/COM or the Windows heap manager), this preconceived notion of magic prevents them from venturing inside Windows to gain more information that can potentially help them solve the problem. To make effective use of this book, you will have to learn how to remove this preconceived notion and truly be of the mind-set that there is no magic behind-the-scenes. The core Windows components should be viewed as an extension of your product and not as a separate and magical layer. After all, its all just code—some of which just happened to be written by other people. If you can adjust your mind-set to accept this, you will have taken your first steps to mastering the art of Windows debugging.\ Software Developers\ Anyone from a low-level system developer to a high-level RAD developer will benefit from reading this book. Whether your preference is writing Windows-based software in assembly language or by using the .NET framework, there is a ton of useful information to be learned about the tools and techniques behind Windows debugging. Over the years, we've had several discussions with higher level RAD developers who claim that they really don't see the need to learn about these low-level topics. After all, the beauty of writing code at a higher level is that all of the low-level intricacies are abstracted and hidden away from the developer. We couldn't agree more. However, our claim is that although abstractive programming allows the developer not to have to focus on low-level details, it does not negate the need to know how the abstraction really works. The substance behind this claim is simple. What you are working with is really just that—an abstraction. Usage of this abstraction in a design that it was not suited for can cause serious problems in your software; and in such a case without a solid understanding of how the abstraction works, it can mean the difference between shipping your product on time and slipping the release date by several months.\ Another key factor when considering mastering the Windows debuggers and tools is related to the debugging of live production servers. While every attempt should be made to fix bugs before shipping a product, we all know that some bugs might slip through the cracks. When these bugs do surface post release, it can be a real headache tracking them down. Customers who encounter the bugs on live production servers are typically very sensitive to downtime and configuration changes, making it impossible to install a complex debugger package. The Debugging Tools for Windows, on the other hand, enables live debugging with no server configuration change and no installation requirements. In short, it enables customers to keep a pristine server during the troubleshooting process.\ Quality Assurance Engineers\ Just as software developers will find the information in this book useful in their day-to-day tasks, so will Quality Assurance engineers. Quality Assurance typically runs a battery of tests on any given component being tested. During this time, any number of bugs can surface. Whether they are memory corruptions, resource leaks, or hangs, knowing what extended instrumentation to enable during the test run can dramatically reduce the time it takes for root cause analysis. For instance, imagine that quality assurance is tasked with stress testing a credit card authorization service. One of the goals is that the service must be capable of surviving one week of continuous and simultaneous hammering by client requests. On day six, the service starts reporting errors for all client requests. At this point, the developers responsible for the service are called in to analyze the problem. It doesn't take long for them to figure out that the server has run out of memory, presumably due to a small memory leak that accumulates over time. After six days of accumulated leaks, figuring out the source of the leak, however, is a much bigger challenge that can take days of debugging and code reviewing. Had the correct extended instrumentation been enabled while running these tests, the time it would have taken to analyze the leak could have been greatly reduced.\ Product Support Engineers\ In much the same way as Quality Assurance uses the Windows debuggers and tools to make root cause analysis more efficient, so can the product support engineers. Product support faces many of the same problems that quality assurance and software developers face on a day by day basis. The key difference, however, is the environmental constraints that they work under. The constraints can include not having full access to the server exhibiting the problems, having a limited amount of time available for troubleshooting the server, having limited access to customer source code, and other issues.\ The information presented in this book will give product support engineers a great deal of ammunition when tackling these tough problems. Knowing how to debug customer problems with minimal downtime and minimal system configuration changes enables product support engineers to much more efficiently and non-intrusively gather the required data to get to the bottom of the problem.\ Where There Is a Will, There Is a Way\ It should come as no surprise that the material presented in this book is highly technical in nature. We are not going to try and convince you that you don't need to know anything about Windows internals to benefit from the book because the simple truth is that you do. As with any technically oriented book, a certain amount of knowledge is assumed.\ Curiosity and a Will to Learn\ While writing this book, we came to the realization that some of the areas of Windows we were writing about had been taken for granted. Sure, most of the time we knew that those areas worked a certain way, but did not know exactly what made them work that way. We could have simply accepted the fact that they just work, but curiosity got the best of us (as it usually does). We spent quite a lot of time researching the topics and trying to connect the dots. The net result was a more in-depth understanding of Windows, which, in turn, allowed us to more efficiently debug problems.\ The basic principle behind learning anything is that there must be a will to learn. Depending on your background, some of the low-level material in the book might feel intimidating. Embrace this intimidation, and you will be in a stronger position to fully grasp and understand the contents of this book.\ If you possess the will to learn and have a great deal of curiosity, you will be well on your way to becoming an expert in Windows debugging.\ C/C++\ All the sample code throughout the book is written in C/C++, and as such a good understanding of the language as well as its object layout is required. If some of the language concepts in the book are unfamiliar to you and you want to brush up on your C/C++ skills, we recommend the following books:\ \ The C++ Programming Language, (3rd Edition), by Bjarne Stroustrup, Boston: Addison-Wesley, 2000.\ Inside the C/C++ Object Model, by Stanley B. Lippman, Reading, MA: Addison-Wesley, 1996.\ \ Windows Internals\ This book is about advanced Windows debugging, and as such parts of the book are dedicated to describing the internals of several integral Windows components (for example, heap manager, RPC, security subsystem). Our intentions are not to fully explain all aspects of these components but rather to give a brief but in-depth summary of how the component functions in relationship to the debugging scenarios being illustrated. If you want to take your knowledge of the internals of Windows even further, we strongly recommend reading\ \ Microsoft Windows Internals, Fourth Edition: Microsoft Windows Server 2003, Windows XP, and Windows 2000, by Mark E. Russinovich and David A. Solomon. Redmond, WA: Microsoft Press, 2004.\ \ Organization\ The book consists of three major parts. In this section, we provide a short description of the contents of each chapter.\ Part I: Overview\ Part I lays the groundwork and provides an overview of the tools and debuggers and gives the readers the ability to familiarize themselves with the fundamentals of the debuggers. Even if you are already familiar with the Windows debuggers, we strongly encourage you to, at the very least, skim through these chapters as they contain a ton of valuable information.\ Chapter 1, "Introduction to the Tools," provides a high-level introduction to the tools used throughout the book. Topics such as download locations, installation instructions, usage scenarios, and sample runs are detailed.\ Chapter 2, "Introduction to the Debuggers," introduces the reader to the fundamentals of the Windows debuggers. Basic concepts such as what debuggers are available, how to use them, and how to configure them are covered.\ Chapter 3, "Debugger Uncovered," provides a more in-depth examination of user mode debuggers. A minimalist implementation of a debugger is provided, as well as looking at more advanced topics such as how the exception dispatch mechanism works.\ Chapter 4, "Managing Symbol and Source Files," discusses how to maintain two of the most critical pieces of information during debugging: symbol files and source files. It gives a brief description of what symbol and source servers are, how to use them in association with the debuggers, and how to effectively manage them by setting up symbol servers and maintaining source servers for you organization.\ Part II: Applied Debugging\ The focus of Part II is to provide the reader with the opportunity to analyze common programming mistakes using the Windows debuggers. Each of the chapters in this section is focused on a particular category of problems, such as memory corruption, memory leaks, and RPC/COM. Each chapter begins with an overview of the Windows component(s) involved followed by one or more scenarios that illustrate common programming mistakes in that area.\ With the exception of Chapters 5 and 6, the chapters in Part II are standalone and can be read in any order.\ Chapter 5, "Memory Corruption I—Stacks," and 6," Memory Corruption II—Heaps," take a close look at a very common problem that plagues developers on a daily basis: memory corruptions. Chapter 5 focuses on stack corruptions, and Chapter 6 on heap corruptions. Each chapter begins by explaining the overall concept behind the type of memory being examined (stack and heap) and is followed by a number of common scenarios under which the corruption can occur. Each scenario has associated sample code and a walkthrough of the process that is used during debugging and root cause analysis.\ Chapter 7, "Security," discusses common security related problems that often surface during development. Quite often, developers face situations in which an API returns an access denied error code without any more in-depth information, making it hard to understand or track down where the error is coming from. This chapter will show several security related examples of code and how to use the debuggers and appropriate tools to get to the bottom of the issue.\ Chapter 8, "Inter-process Communication," focuses solely on inter-process communication debugging. Arguably perhaps the most used inter-process communication protocol in Windows but also the most magical is RPC/LPC. Knowing how to troubleshoot this super important component is paramount when working with most applications. Using the debuggers, this chapter will show how you can track identity, analyze RPC failures, and much more.\ Chapter 9, "Resource Leaks," details a very common problem with software today: resource leaks. The most common form of resource leaks is related to memory but not limited to it. Other examples includes registry keys, file handles, and so on. This chapter takes a look at the resource leak problem by showing a number of scenarios and associated sample code, as well as how to use the debuggers and tools to efficiently track them down.\ Chapter 10, "Synchronization," discusses the topic of application hangs and how to most efficiently make use of the debuggers to track down synchronization problems such as deadlocks and lock contentions. A number of different synchronization scenarios are examined with associated debug sessions that give an in-depth view of the analysis process.\ Part III: Advanced Topics\ Part III is an advanced section that consists of chapters that discuss topics such as postmortem debugging, managed code debugging, Windows Vista fundamentals, and much more. The goal of these chapters is not to provide an exhaustive examination of each area, but rather provide just enough fundamentals for the reader to get started in the topic explained.\ Chapter 11, "Writing Custom Debugger Extensions," talks about custom debugger extensions. Even though the Windows debuggers pack an extremely powerful set of commands and tools, there are times when you want to automate certain aspects of your own application debugging sessions. This chapter details how the extensibility model of the debuggers works and describes an example of a sample custom debugger extension.\ Chapter 12, "64-bit Debugging," introduces the basic concepts of debugging 64-bit architectures. Basic concepts such as stack traces, function calls, and parameter passing are discussed to enable the reader to get started on debugging these powerful architectures.\ Chapter 13, "Postmortem Debugging," discusses postmortem debugging, which is an incredible useful way of troubleshooting problems when there is no means of debugging a problem at the point of occurrence. This is a very common form of debugging once the product has shipped and problems surface on the customer site.\ Chapter 14, "Power Tools," discusses two powerful tools that can be used to automate the debugging process. The first tool is called DebugDiag, and it provides an excellent way of automating resource leak debugging. The other tool is a command called analyze, which automates the initial fault analysis process.\ Chapter 15, "Windows Vista Fundamentals," details some of the fundamentals behind Windows Vista. With the introduction of the new generation Windows platform, certain aspects of the operating system has changed dramatically and some of the key changes are outlined in this chapter.\ Required Tools\ All the tools required to make full use of this book are available as downloads free of charge. The new Windows Drivers Kit contains a complete command line C/C++ development environment and a great set of associated development tools.\ Sample Code\ As software engineers, we spend a great deal of our time hunting for the ultimate treasure of writing perfect code. While writing this book, we were faced with quite the opposite chore—the need to write not so perfect code to illustrate common programming mistakes.\ The sample code is structured to achieve one goal: present examples of common programming mistake in the shortest and most concise fashion as to not pollute the basic principle of the programming mistake being examined. To satisfy the goal of short and concise examples, we had to, at times, concoct examples rather than use real-life examples. Even though the sample code is "made up," it serves to simulate real-life examples, and every effort was made to ensure that the example stays true to the problem being examined.\ All sample code is written in C/C++. We chose this language for two simple reasons:\ \ C/C++ is predominantly used in Windows development.\ In order not to obscure the debugging concepts discussed with higher level abstractions, we chose the language that is most commonly used and also closest to the hardware.\ \ All sample code is compiled and tested using the Windows Drivers Kit. The WDK was chosen so that readers would be able to enjoy learning the art of Windows debugging without being required to purchase a complete developer suite.\ The source code assumes a Unicode environment, and as such Win32 API calls, as seen in the debugger, will be illustrated using the Unicode version of the API. For example, the sample code might show a call to the CreateProcess API, but when working in the debugger, the CreateProcessW API will be utilized. The API shown in the debugger is prefixed by the module name implementing the API. One example is the CreateProcessW API, which is implemented in kernel32.dll. It is often required to specify both the module name and the API name separated by the (!) character (kernel32!CreateProcessW).\ All sample code and binaries are available on the book's Web site ( http://www.advancedwindowsdebugging.com). In addition to source code and binaries being available, the site also acts as a symbol server for the book's binaries. When you try out the debugging sessions illustrated in the book, there is no need to download all the symbols for the binaries; rather, point your debuggers symbol path directly to the books symbol server, and you can debug with remote symbols. The sources are also retrieved by the source servers from the book's Web site.\ In order to provide a consistent learning experience, the binaries on the book's Web site have been built as nonoptimized and checked releases for the x86 architecture using the Windows XP platform. We chose to use Windows XP as the common denominator due to its widespread usage. If you choose to build the samples on your own using a different target platform, there might be minor variations in the debug output.\ To build the samples on your own, simply open a WDK build window and type build /ZCc from the directory containing the makefile. If the source code being compiled requires additional steps, those steps will be spelled out in the chapter discussing the sample code.\ Throughout the book, it is assumed that all binaries have been downloaded from the Web site and copied to the local hard drive (keeping the folder structure intact) to the following location: C:\\AWDBIN, and the sources have been downloaded to the C:\\AWD folder.\ Conventions\ Code, command line activity, and syntax descriptions appear in the book in a monospaced font. Many of the examples and walkthroughs in this book show a great deal of what is known as debug spew. Debug spew simply refers to the output that the debugger displays as a result of some action that the user takes. Typically, this debug spew consists of information shown in a very compact and concise form. In order to effectively reference bits and pieces of this data and make it easy for you to follow, the boldface and italic types are used. Additionally, anything with the boldface type in the debug spew indicates commands that you will be entering. The following example illustrates the mechanism.\ 0:000> ~*kb. 0 Id: 924.a18 Suspend: 1 Teb: 7ffdf000 UnfrozenChildEBP RetAddr Args to Child0007fb1c 7c93edc0 7ffdf000 7ffd4000 00000000 ntdll!DbgBreakPoint0007fc94 7c921639 0007fd30 7c900000 0007fce0 ntdll!LdrpInitializeProcess+0xffa0007fd1c 7c90eac7 0007fd30 7c900000 00000000 ntdll!_LdrpInitialize+0x18300000000 00000000 00000000 00000000 00000000 ntdll!KiUserApcDispatcher+0x70:000> dd 0007fd300007fd30 00010017 00000000 00000000 000000000007fd40 00000000 00000000 00000000 ffffffff0007fd50 ffffffff f735533e f7368528 ffffffff0007fd60 f73754c8 804eddf9 8674f020 852525500007fd70 86770f38 f73f4459 b2f3fad0 804eddf90007fd80 b30dccd1 852526bc b30e81c1 855be9440007fd90 85252560 85668400 85116538 852526bc0007fda0 852526bc 00000000 00000000 00000000\ In this example, you are expected to type in ~*kb in the debug session. The result of entering that command shows several lines with the most critical piece of information being 0007fd30. Next, you should enter the dd 0007fd30 command illustrated to glean more information about the previously highlighted number 0007fd30.\ All tools used in this book are assumed to be launched from their installation folder. For example, if the Windows debuggers are installed in the C:\\Program Files\\Debugging Tools for Windows folder, the command line for launching windbg.exe will be shown as\ C:\\>windbgSupported Windows Versions\ Windows XP or higher is required to fully make use of this book. All sample code and debugging scenarios have been run on Windows XP SP2 or Windows Server 2003 SP1, depending on the requirements of the specific scenario. Please note that service packs or even specific patches can change the result of a various commands, although these changes will not affect the overall outcome of what is being illustrated with the debug session.\ Chapter 15, "Windows Vista Fundamentals," covers the most important changes made in Windows Vista and includes debug sessions that must be run on a machine running Windows Vista.\ Furthermore, all samples and debug sessions were run using the 32-bit version of Windows. Samples used in Chapter 12, "64-bit Debugging," were run using the 64-bit version of Windows XP.
Part I OverviewChapter 1 Introduction to the ToolsChapter 2 Introduction to the DebuggersChapter 3 Debugger UncoveredChapter 4 Managing Symbol and Source FilesPart II Applied DebuggingChapter 5 Memory Corruptions Part I — StacksChapter 6 Memory Corruptions Part I — HeapsChapter 7 SecurityChapter 8 Inter-process CommunicationChapter 9 Resource LeaksChapter 10 SynchronizationPart III Advanced TopicsChapter 11 Writing Custom Debugger ExtensionsChapter 12 64-bit DebuggingChapter 13 Postmortem DebuggingChapter 14 Power ToolsChapter 15 Windows Vista FundamentalsAppendix A Application Verifier Test SettingsIndex
\ From Barnes & NobleYes, it's better to prevent bugs, but software must still be carefully debugged, and few Windows programmers are experts at debugging. Mario Hewardt and Daniel Pravat are. In Advanced Windows Debugging, they share literally decades of experience with both the techniques and the tools. \ This is a proudly technical book for serious developers who are familiar with (or at least interested in) Windows internals. The authors thoroughly cover core debugging skills, including effective symbol and source file management. Next, they drill down on each type of software flaw: memory corruption (stacks and heaps), IPC problems, resource leaks, application hangs, even "access denied" problems. Part III journeys even further: into the challenges of 64-bit debugging; into debugging problems arising after shipment; into automating testing via custom debugger extensions.\ If you really care what your code is doing (and you're serious about quality), there's no substitute for this book. Bill Camarda, from the February 2008 Read Only\ \ \
