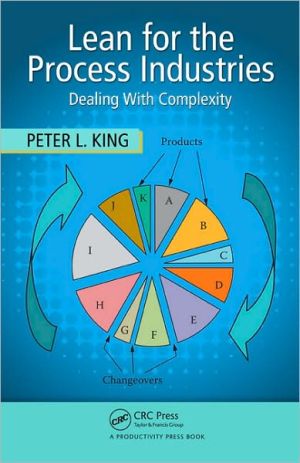
Lean for the Process Industries: Dealing with Complexity
Compared to its widespread implementation across almost all areas of production, Lean improvement efforts lag within the process industries. While, a number of innovators have successfully applied Lean principles to these industries over the last two decades, most of those pioneering efforts were never recorded to guide the improvement efforts of others.\ Drawing on 40 years of application experience at one of the world’s largest chemical and materials manufacturers, Peter King corrects this...
Search in google:
Compared to its widespread implementation across almost all areas of production, Lean improvement efforts lag within the process industries. While, a number of innovators have successfully applied Lean principles to these industries over the last two decades, most of those pioneering efforts were never recorded to guide the improvement efforts of others.Drawing on 40 years of application experience at one of the world’s largest chemical and materials manufacturers, Peter King corrects this void by providing the first comprehensive resource written explicitly for change agents within the process industries. Focusing on areas where the improvement needs of the process industry differ from parts assembly manufacturing, Lean for the Process Industries: Dealing with Complexity —Covers each of the eight wastes commonly described in Lean literature, looking at how they manifest themselves in process operationsExplains how to adapt value stream mapping for process operationsShows how to identify the root causes of bottlenecks, and systemically eliminate themProvides process-oriented modifications that will enhance the usefulness of Cellular Manufacturing, Heijunka Production Leveling, and Pull Replenishment Systems Discusses the role of process operations management in a Lean strategy Whether you are manufacturing consumer products such as foods, paints, and pharmaceuticals, or materials such as bulk chemicals, sheet goods, and synthetic fibers, this book shows you how to achieve that enviable level of performance where continual improvement becomes inherent to your processes.
Acknowledgments xvIntroduction xviiPart I Lean and the Process IndustriesChapter 1 Lean Overview: Principles and Tools 3Origins of Lean 3TPS Becomes the New Production Paradigm 6Essence of Lean 8Fourteen Lean Tools 11Lean Tool 1 Value Stream Mapping (VSM) 11Lean Tool 2 Takt Time 11Lean Tool 3 Kaizen 12Lean Tool 4 5S 12Lean Tool 5 Jidoka 12Lean Tool 6 Single Minute Exchange of Dies (SMED) 13Lean Tool 7 Poka-Yoke 13Lean Tool 8 Five Whys 13Lean Tool 9 Standard Work 13Lean Tool 10 Total Productive Maintenance (TPM) 14Lean Tool 11 Cellular Manufacturing 14Lean Tool 12 Heijunka 14Lean Tool 13 Just-In-Time (Pull) 15Lean Tool 14 Kanban 15Further Information 15Lean Today 16Summary 17Chapter 2 Distinguishing Characteristics of Process Industry Manufacturing 19Process Industries versus Assembly Operations 19Characteristics That Distinguish the Process Industries 21The Three Vs: Volume, Variety, and Variability 21Capital Intensive versus Labor Intensive 22Throughput Is Limited by Equipment Rather Than by Labor 23Equipment Is Large and Difficult to Relocate 24Processes Are Difficult to Stop and Restart 24Product Changeover Issues Are Complex 24Finished Product Inventory versus WIP 25Hidden WIP 26Material Flow Patterns in Assembly and Process Plants (SKU Fan Out) 26Examples of "V" Type Process in Process Plants 28Product Differentiation Points 32Summary 33Chapter 3 The Seven (or Eight, or Nine) Wastes in the Process Industries 37Value and Waste 37Waste of Overproduction 38Waste of Time on Hand (Waiting) 40Waste in Transportation 42Waste of Processing Itself43Waste of Stock on Hand (Inventory) 44Capacity Differences: Rate Synchronization 45Bottleneck Protection 46Campaign Sizes 46Inappropriate Product Differentiation 46Tank Heels 47Waste of Movement 47Waste of Making Defective Parts 48Waste of Human Creativity 49Time as a Waste 50Necessary versus Unnecessary Waste 51Summary 52Part II Seeing the WasteChapter 4 Value Stream Mapping the Process Industries 57Introduction to Value Stream Mapping 57Benefits of a Value Stream Map 58Generating the Map 59Direction of Flow 60Product Families 60Takt and Cycle Time 61Takt Time 61Cycle Time 62Takt Rate versus Takt Time 63Units of Production 63Where to Begin 66Level of Detail 66Process Box 68Data Boxes 69Customer Data Box 69Process Step Data Box 70Inventory Data Box 73Transportation Data Box 74Supplier Data Box 75Information Flow 75The Timeline 78An Example VSM 81Additional VSM Best Practices 81Parallel Equipment 81Logical Flow versus Geographic Arrangement 84Summary 88Chapter 5 Reading and Analyzing the Current State Value Stream Map 89Analyzing the Current State Map 89Voice of the Customer 90Waste 90Non-Value-Adding Activities 91Flow and Bottlenecks 91Variability 92Other Opportunities 92Learning from Material Flow 93Learning from Information Flow 98Tools to Get to Root Cause 101The Five Whys (5W) 101Detailed Process Mapping 102The Ishikawa Diagram 102Cross-Functional Process Mapping 102Creating the Future State VSM 104Summary 107Part III Lean Tools Needing Little ModificationChapter 6 Total Productive Maintenance 111TPM and Lean Synergy 112TPM in the Process Industries 113TPM and Reliability-Centered Maintenance 114The Benefits of TPM 114TPM Measures 114Overall Equipment Effectiveness 115Availability 115Performance 115Quality 116UPtime 116Calculation of OEE and UPtime 118Calculation of OEE 118Calculation of UPtime 120VSM Data Boxes: OEE or UPtime 120Summary 121Chapter 7 Setup Reduction and SMED 123SMED and Its Origins 123SMED Concepts 124Product Transitions in the Process Industries 126A Changeover Where All Tasks Are Completely Manual 127A Changeover Completely in Chemistry and/or Physics 128A Changeover That Includes a Combination of Manual Tasks and Chemistry/Physics 128SMED beyond Product Changes 130A Non-Manufacturing Example 131Summary 132Chapter 8 Visual Management 135Introduction to the Visual Plant 135Visual Work Area 137Visual Displays 138Visual Scheduling 139Andons 144Metrics 144Management by Sight and Frequent Communication 145Process Industry Challenges 145Summary 147Chapter 9 Kaizen Events 149Kaizen by Specific Events 149Quality Circles versus Kaizen Events 151Steps in the Kaizen Event Process 151Planning 152Conducting the Event 153Following-Up 154Appropriate Event Scope Areas 154Kaizen Dangers: The Root Causes of Kaizen Failures 155Process Industry Unique Requirements 157Kaizen Events as Six Sigma Projects 158Summary 160Part IV Lean Tools Needing a Different ApproachChapter 10 Finding, Managing, and Improving Bottlenecks 163Bottlenecks in Process Plants 163Moving Bottlenecks 165Recognizing Covert Bottlenecks 167The Root Causes of Bottlenecks 168Bottleneck Management: Theory of Constraints 171Widening the Bottleneck: Lurking Bottlenecks 174Summary 175Chapter 11 Cellular Manufacturing in the Process Industries 177The Process Layout (Pre-Cellular Manufacturing in Assembly Plants) 177The Product Layout (Cellular Manufacturing in Assembly Plants) 178Cell Application in the Process Industries 180Typical Process Plant Equipment Configurations 181Virtual Cells 185Case Study: Virtual Cell Implementation in a Synthetic Rubber Production Facility 189The Result: Synthetic Rubber Virtual Work Cells 193Steps in Virtual Work Cell Design 195Step 1 Start with the Current State Value Stream Map 195Step 2 Determine Preliminary Asset Groups or Virtual Cells 196Step 3 Determine Preliminary Product Grouping (Group Technology) 196Step 4 Assign Each Product Group to a Manufacturing Cell 196Step 5 Define a Few Swing Products 198Step 6 Review the Plan 198Step 7 Document Virtual Cell Arrangements, Flow Patterns, Product Lineups, and Operating Rules 199Step 8 Mark Each Cell Visually 199Step 9 Modify Scheduling Processes Accordingly 199Step 10 Ensure that Appropriate Managing Processes Are in Place 199Summary 201Chapter 12 Product Wheels: Production Scheduling, Production Sequencing, Production Leveling 203Solutions in Assembly Processes 203Process Industry Challenges 205A Process Industry Solution: The Product Wheel Concept 206Product Wheel Design 209Step 1 Determine Which Process Steps Should Be Scheduled by Product Wheels 211Step 2 Analyze Product Demand Variability 212Step 3 Determine the Optimum Sequence 215Step 4 Calculate Shortest Wheel Time Possible (Available Time Model) 216Step 5 Estimate Economic Optimum Wheel Time (the EOQ Model) 217Step 6 Determine the Wheel Time (Making the Choice) 219Step 7 Calculate Inventory Requirements 222Step 8 Fine-Tune the Design 224Step 9 Revise the Current Scheduling Process 225Step 10 Create a Visual Display 225Benefits of Product Wheels 226Some Additional Points 227Summary 228Chapter 13 Postponement in the Process Industries: Finish to Order 229Finish to Order 230Examples of Finish to Order: FTO in Assembly 230FTO in the Process Industries 232FTO within Process Plants 232The Benefits of FTO 233Example of FTO in a Process Plant 234A Further Example: Bond to Order 237Summary 240Chapter 14 Pull Replenishment Systems 241What Is Pull? 241Pull in Assembly 243Difficulties in Process Plants 245Push-Pull Interface 246ConWIP 250Development of Pull on the Sheet Goods Process 254Visual Signals 258When to Start Pulling: The Sequence of Implementation 260Creating Pull 261Value Stream Focus 263Traditional Pull Strategies and Signals 265Push in Real Life 266Summary 267Chapter 15 Supermarket Design 269Understanding the Supermarket Concept 270Inventory Types and Supermarkets 271Inventory Components Defined: Cycle Stock and Safety Stock 272Calculating Cycle Stock 275Calculating Cycle Stock: Fixed Interval Replenishment Model 275Calculating Cycle Stock: Fixed Quantity Replenishment Model 278Calculating Safety Stock 281Variability in Demand 281Variability in Lead Time 283Combined Variability 284Cycle Service Level and Fill Rate 284Example: The Product Wheel for Forming Machine 1 286Alternatives to Safety Stock 290Signaling Methods 291The Role of Forecasting 292Summary 293Chapter 16 The Importance of Leadership and Robust Business Processes 295Business Practices and Targets 296ABC Classification 296Customer Lead Times 297Customer Service Levels 298MTS, MTO, and FTO 298Demand Variability Analysis 298Protection (Safety Stock or Contingency Processes) 299SKU Rationalization 299Integrated Business and Operations Planning 300Poor Business Practices 300Dictating Low Safety Stock Levels 300Expecting Abnormally Short Lead Times 300Expecting Perfect Customer Service 301Reducing Inventory at Year End 301Pulling Next Quarter's Sales Ahead 301Obsessing over Cost Reduction 302Inappropriate Use of Metrics 302Summary 303Part V AppendicesAppendix A Determination of Appropriate Raw Material Inventory 307Appendix B References 311Index 313About the Author 333
