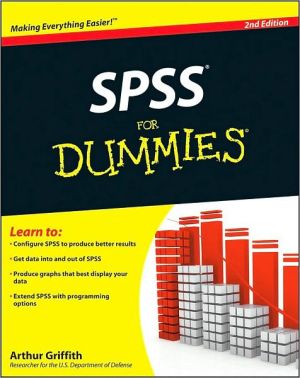
SPSS For Dummies
The fun and friendly guide to the world's leading statistical software\ Predictive Analysis Software (PASW), formerly SPSS software, is the leading statistical software used by commerical, government, and academic organizations around the world to solve business and research problems. It allows you to quickly and easily discover new insights from data, test hypotheses, and build powerful predictive models.\ PASW Statistics For Dummies covers everything you need to know to get up and running...
Search in google:
Need to analyze some data? SPSS is your statistical friend — let it crunch the numbers!Surprise — this book is not about statistics. It's about using SPSS to calculate statistics for you! Here are step-by-step procedures you can follow to see how SPSS operates and start using it with your own data. You'll be able to enter data, produce graphs, use the statistical methods built into SPSS to generate the numbers you need, and much more.Predict the future — use SPSS to identify business risks and opportunities Learn your way around — install SPSS and set up the options to serve your needs Enter the data — instruct SPSS to collect data from a database or another file, or type it in yourselfData in, data out — export the results of your analysis for use in a database, Web page, Excel® worksheet, or Word document Go graphic — create bar graphs, line charts, scatterplots, pie charts, histograms, and othersWelcome to analysis — learn different ways SPSS can crunch numbers and how to get the analysis you're looking forExtend the possibilities — customize SPSS with Command Syntax or create new scripts with Python® Your greatest asset — protect your data and make regular backupsOpen the book and find:What you can and can't do with SPSSTypes of graphs and how to use them How to manually enter dataSuggestions for sorting, identifying, and grouping dataData types and how to use them What a scatterplot can show youHow to back up and protect your data A glossary of SPSS and statistics terms
Introduction 1About This Book 1About the Data 2Who This Book Is For 2How This Book Is Organized 2The Fundamental Mechanics of SPSS 3Getting Data into and out of SPSS 3Graphing Data 3Analysis 3Programming SPSS with Command Syntax 4Programming SPSS with Python and Scripts 4The Part of Tens 4Icons Used in This Book 4Where to Go from Here 5The fundamental Mechanics of SPSS 7Introducing SPSS 9Garbage In, Garbage Out 9From Whence SPSS? 10The Four Ways to Talk to SPSS 11The Things You Can and Cannot Do with SPSS 12How SPSS Works 12All the Strange Words 14All Those Files 14Where to Get Help When You Need It 15Your Most Valuable Possession 16You Can Dive As Deep As You Want to Go 16Installing and Running the Software 17Getting SPSS into Your Computer 17The things you need 18Cranking up the installer 18The SPSS installation sequence 19Registration 25Starting SPSS 26The Default Settings and What They Can Become 27General options 28Viewer options 29Draft viewer options 31Labeling output 32Chart options 33Interactive chart options 34Pivot table options 35A few data-handling options 36Currency formats 37Scripts options 39A Simple Statistical Analysis Example 41When the Tanana at Nenana Thaws 41Entering the Data 42The data definitions 42The actual data 46The Most Likely Hour 49Transforming Data 51The Two Kinds of Numbers 54The Day It Is Most Likely to Happen 56Getting Data into and out of SPSS 59Entering Data from the Keyboard 61The Variable View is for Entering Variable Definitions 61Name 62Type 63Width 66Decimals 66Label 66Value 67Missing 68Columns 69Align 69Measure 69The Data View Is for Entering and Viewing Data Items 71Filling In Missed Categorical Values 72Reading and Writing Files 75The SPSS File Format 75Formatting a Text File for Input into SPSS 76Reading Simple Data from a Text File 76Transferring Data from Another Program 84Reading from an unknown program type 85Reading an Excel file 85Reading from a known program type 87Saving Data and Images 88Data and Data Types 91Dates and Times 91Time Schedule 94Creating a Multiple Response Set 96Copying Data Properties 99Messing with the Data After It's in There 103Sorting Cases 103Using an ID to Identify Cases 106Counting Case Occurrences 107Recoding Variables 111Same-variable recoding 111Different variable recoding 113Automatic recoding 115Binning 117Getting Data out of SPSS 123Printing 123Exporting to a Database 124Using SPSS Viewer 124Creating an HTML Web page file 126Creating a text file 127Creating an Excel file 129Creating a Word document file 130Creating a PowerPoint slide document 132Creating a PDF document 133Graphing Data 137Fundamentals of Graphing 139Building Graphs the Easy Way 140Gallery tab 140Basic Elements tab 142Groups/Point ID tab 145Titles and footnotes tab 146Element Properties dialog box 146Options 151Building Graphs the Fast Way 152Building Graphs the Old-Fashioned Way 153Editing a Graph 154Some Types of Graphs 157Line Chart 157Simple line chart 158A chart with multiple lines 159Scatterplots 160A simple scatterplot 160Scatterplot showing multiple variables 162Three-dimensional scatterplot 163Dot plot 164Scatterplot matrix 165Drop-line chart 165Bar Graphs 167Simple bar graph 167Clustered bar chart 168Stacked bar chart 169Three-dimensional bar chart 171Error bars 172More Types of Graphs 175Histograms 175Simple histogram 176Stacked histogram 177Frequency polygon 178Population pyramid 179Area Graphs 180Simple area graph 181Stacked area chart 182Pie Charts 183Boxplots 184Simple boxplot 184Clustered boxplot 185One-dimensional boxplot 186High-Low Graphs 188High-low close 188Simple range bar 188Differenced area 190Dual-Axis Graphs 191Dual Y-axes with categorical X-axis 191Dual Y-axes with scale X-axis 192Maps 195Relating Geography and Data 195Range of Values 198Dot Density 200Graduated Symbol 202Individual Values 205Bar Charts 207Multiple Themes 209Analysis 211Executing an Analysis 213Report Generation 213Processing summaries 214Case summaries 214Summaries in rows 217Summaries in columns 221OLAP cubes 223Pivot Tables 226Some Analysis Examples 229Comparison of Means 229Simple mean compare 230One-sample T test 231Independent-samples T test 232Paired-samples T test 233One-way ANOVA 233Linear model 234One variable 234More than one variable 235Correlation 237Bivariate 237Partial correlation 238Regression 239Linear 239Curve estimation 240Log Linear 242Programming SPSS with Command Syntax 215The Command Syntax Language 247Commands 247Keywords 248Variables and Constants 248Data Declaration 249Comments 250The Execution of Commands 251Flow Control and Conditional Execution 252IF 252DO IF 254SELECT IF 254DO REPEAT 254LOOP 255BREAK 256Files 256GET 257IMPORT 257SAVE 258EXPORT 258Command Syntax Language Examples 259Writing a Syntax Command Program 259Saving and Restoring Programs 261Adding a Syntax Program to the Menu 261Doing Several Things at Once 265Graphing P-P and Q-Q Plots 266Splitting Cases 267Examining Data 269Programming SPSS with Python and Scripts 271The Python Programming Language 273You Type It In and Python Does It 273The Way Python Does Arithmetic 274The Way Python Handles Words 276The Way Python Handles Lists 280Making Functions 281Asking Questions with if 283Doing It Over Again with for and while 285Python inside SPSS 289Installing Python for SPSS 289A Language inside a Language 294Finding out about modules 295Installing more modules 296Multiple Commands with One Submit 296Working with SPSS Variables 297Accessing SPSS from Outside 298Scripts 299Picking Up BASIC 299Scripting Fundamentals 300Software classes, objects, and references 300The classes of SPSS 301Properties and methods 302Creating a New Script 304Global Procedures 305Automatic Scripts 305The Part of Tens 301Ten Modules You Can Add to SPSS 309Geoset Manager 309Amos 310Missing Value Analysis 310Regression Models 311Advanced Multivariate Models 311Exact Tests 312SPSS Categories 312SPSS Trends 313SPSS Map 313SPSS Complex Samples 314Ten Useful Things You Can Find on the Internet 315SPSS Humor 316The SPSS Home Page 316SPSS Developer Center 316User Groups 317Mailing Lists and News Groups 317Python Programming 318Script and Syntax Programming 319Tutorials for SPSS and Statistics 319SPSS Wiki 321PSPP, a Free SPSS 321Glossary 323Index 331


