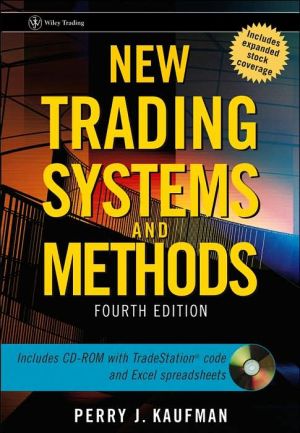
New Trading Systems and Methods (Wiley Trading Series)
PRAISE FOR NEW TRADING SYSTEMS AND METHODS FOURTH EDITION\ "Probably the most comprehensive guide to trading systems ever written from one of the foremost experts in the field. This is an invaluable reference work for anyone with an interest in trading systems."\ —Jack D. Schwager, author of The New Market Wizards and the Schwager on Futures book series\ "In trading, timing is everything, and now is the time to read this excellent and easy- to-follow book on technical trading systems by Perry...
Search in google:
Get the bestselling guide to trading systems, now updated for the 21st century. For more than two decades, futures traders have turned to the classic Trading Systems and Methods for complete information about the latest, most successful indicators, programs, algorithms, and systems. Perry Kaufman, a leading futures expert highly respected for his years of experience in research and trading, has thoroughly updated this bestselling guide, adding more systems, more methods, and extensive risk analysis to keep this the most comprehensive and instructional book on trading systems today. His detailed, hands-on manual offers a complete analysis, using a systematic approach with in-depth explanations of each technique. This edition also includes a CD-ROM that contains the TradeStation EasyLanguage program, Excel spreadsheets, and Fortran programs that appear in the book.
New Trading Systems and Methods\ \ By Perry Kaufman \ John Wiley & Sons\ ISBN: 0-471-26847-X \ \ \ Chapter One\ Let's start by redefining the term "technical analysis." Technical analysis is the systematic evaluation of price, volume, breadth, and open interest, for the purpose of price forecasting. A systematic approach may simply use a bar chart and a ruler, or it may use all the computer power available. Technical analysis may include any quantitative analysis as well as all forms of pattern recognition. Its objective is to decide, in advance, where prices will go over some time period, whether 1 hour or 5 years. Technical analysis must have clear rules. \ Technical analysis is no longer just the study of chart patterns or the identification of trends. It encompasses intramarket analysis, complex indicators, mean reversion, and the evaluation of test results. It can use a simple moving average or a neural network to forecast price moves. This book serves as a reference guide for all of these techniques, puts them in some order, and explains the functional similarities and differences for the purpose of trading.\ THE EXPANDING ROLE OF TECHNICAL ANALYSIS\ Quantitative methods for evaluating price movement and making trading decisions have become a dominant part of market analysis. Those who do not use methods such as overbought and oversold indicators are most likely to watch them along the bottom of their screen. The major financial networks are always pointing out pricetrends and double bottoms, and are quick to say that a price move up or down was done on low volume to show that it might be unreliable. These comments show the simplicity and the acceptance of technical analysis.\ Events beginning in 2002 cast doubt on the integrity of the research produced by major financial houses that have a conflict between financing/underwriting and retail brokerage. The exposure of Enron also cause us to question the earnings, debt, quality of business, and other company data released to the public by large and small firms. It is not surprising that more quantitative trading methods have been adopted by these firms. When decisions are made with clear rules and calculations that can be audited, those analysts recommending buys and sells are safe from scrutiny.\ Extensive quantitative trading exists around the world. Interest rate arbitrage is a major source of revenue for banks. Location arbitrage is the process that keeps the price of gold and other precious metals the same all over the globe. Program trading keeps the price of individual stocks within a narrow band of the S&P futures and Spyder prices.\ If you don't think of arbitrage as technical trading then consider market neutral strategies, where long and short positions are taken in related markets (pairs trading) in order to profit from the relative move, one stock rising or falling faster than the other. You might prefer to take advantage of the seasonality in the airline industry or try your hand trading soybeans. Both have clear seasonal patterns as well as years when other factors (such as the Iraqi War) overwhelm the seasonal factors. Trading seasonal patterns falls under technical analysis.\ Technology that allows you to scan and sort thousands of stocks, looking for key Attributes-such as high momentum, a recent breakout, or other indicator values-is also technical analysis on a broader scale.\ Most impressive is the increase in managed funds that use technical and quantitative analysis. Many billions of investment dollars are trading using trend-following systems, short-term timing, mean reversion, and countless other techniques. Technical analysis allows you to backtest and estimate the expected risk, two great advantages to the fund manager. The use of technical analysis has infiltrated even the most guarded fundamental fortresses.\ CONVERGENCE OF TRADING STYLES IN STOCKS AND FUTURES\ The development of technical analysis has taken a different path for stocks and futures. This seems natural because the two markets cater to investors with different time frames. At the same time the markets place very different financial demands on the investor.\ The original users of the futures markets were grain elevators and grain processors, representing the supply side and the demand side, respectively. The elevators are the grain wholesalers who bought from the farmers and sold to the processors. The futures markets represented the fair price and grain elevators sold their inventory on the Chicago Board of Trade in order to lock in a price (hopefully a profit). The processor, typically a bread manufacturer or feedlot operator, used the futures markets to lock in a low price for their material cost and as a substitution for the storage of inventory. Both producer (the sell side) and processor (the buy side) only planned to hold the position for a few weeks or a few months, until they either delivered their product to market or purchased physical inventory for production. There was no long-term investment. Futures contracts, just like stock options, expire every two or three months and can be traded for about one year; therefore, it is nearly impossible to "invest" in futures.\ One other critical difference between futures and stocks is the leverage available in futures. When a processor buys one contract of wheat, that processor puts up a good faith deposit of about 5% of the value of the contract. If wheat is selling for $3.00 a bushel and a standard contract is for 5,000 bushels, the contract value is $15,000. The processor need only deposit $750 with the broker. The processor is essentially buying on leverage of 20:1.\ Even in the 1970s, the futures trader paid an outrageous round-turn commission of $50 per contract. This is about .3 of one percent, and was probably one of the highest commission ratios in the futures industry. Now, years after negotiated commissions have become part of the system, the fee is closer to $8, or .05 of one percent. Commission costs are so low that they are not a consideration when trading futures.\ How does the short holding period, high leverage, and low commissions affect trading in futures? Futures traders have short holding periods and tight risk controls. They use fast techniques and try to anticipate price moves. They don't invest-they trade. In the derivatives markets, fast is one to three days, and slow is anything longer than thirty days.\ Although speculation has always had a place in the stock market, the investor, rather than the trader, has been the major force. The stock market is an investment in America. The growth of the economy parallels the growth and efficiency of industry. Of course, commissions and tax regulations played a large part in shaping the long-term view of the investor. With commission costs of 1% for each buy and sell order, it is not possible to be a short-term trader. That role was reserved for the market maker on the floor of the stock exchange. It is difficult to be a trader of any sort when you pare 2% from each of your trades. In addition, favorable tax treatment strongly encouraged holding positions for a long-term capital gain, at least six months. The uptick rule for selling discourages speculation on the decline of stock prices. And even now, short sales are not allowed in most retirement funds. Given the difference in the type of investor caused by commissions and regulation, the type of trading in stocks and futures was very different.\ The change in stock trading has been in direct response to lower commission and is partly due to electronic trading. Where once you would have paid 25¢ to buy or sell Microsoft at $25 (50¢ total for a trade), anyone can now pay $10 per order-1¢ per share on a 1,000 share order-or slightly higher for smaller lots. That is a commission rate of .04%, four hundredths of one percent-right in line with futures.\ Low commissions in stocks open up the possibility of fast trading. Low commissions do not resolve the issue of being able to execute a short sale as quickly as a buy, and they do not provide the leverage of the futures markets, but they do expand the opportunities. In index markets, which have exceptionally high volatility, short-term trading has become popular. Stock traders now look to the methods used by futures traders to identify trends faster and use tighter risk control.\ A LINE IN THE SAND BETWEEN FUNDAMENTALS AND TECHNICALS\ The market is driven by fundamentals. It is also driven by consumer confidence, supply and demand, geopolitical factors, and expectations of price movement. It is just too difficult to trade using those facts. There is no timely indication that the value of a company has changed, that supply has increased, that the world has resolved its differences, or that expectations have changed. Recently we have had the disturbing realization that the data we use to make fundamental decisions may not be reliable.\ Technical analysis, when used to determine the long-term direction of prices, attempts to objectively evaluate these complex fundamentals. It is no different from the economists who use regression, seasonal, and cyclic analysis to forecast the economy. The technical trader can use those tools as well as chart trendlines, pattern recognition, and probability distributions. Perhaps the economists are doing the same thing.\ It is well known that the Federal Reserve monitors trading and prices in order to decide how to time their rate changes and, when necessary, their currency intervention. Even the Fed knows that, when the dollar is falling like a rock, you don't try to catch it. If the public wants to sell the dollar, the Fed doesn't have enough clout to stop it. It must use its resources carefully, and it uses market know-how and price analysis to time its actions.\ The primary advantages of a technical approach are that it is objective and completely self-contained. The accuracy of the data is certain. One of the first great advocates of price analysis, Charles Dow, said:\ The market reflects all the jobber knows about the condition of the textile trade; all the banker knows about the money market; all that the best-informed president knows of his own business, together with his knowledge of all other businesses; it sees the general condition of transportation in a way that the president of no single railroad can ever see; it is better informed on crops than the farmer or even the Department of Agriculture. In fact, the market reduces to a bloodless verdict all knowledge bearing on finance, both domestic and foreign.\ Much of the price movement reflected in any market is anticipatory; it results from the expectations of the effects of macroeconomic developments or the outcome of good corporate management and new products. Markets, however, are subject to change without notice. For example, the government may block the merger of two companies, or approve or reject a new drug. A hurricane bound for the Philippines may send sugar prices higher, but if the storm turns off course, prices may reverse. Anticipation of employment reports, housing starts, or corn production reports causes highly publicized professional estimates, which may correctly or incorrectly move prices before the actual report is released. Markets then react to the accuracy of the estimates rather than to the economic data itself. By the time the public is ready to act, the news is already reflected in the price.\ PROFESSIONAL AND AMATEUR\ Beginning technical traders may find a system or technique that seems extremely simple and convenient to follow, one that seems to have been overlooked by the professionals. Most often there is a simple reason why that method isn't used. As you learn more about trading, you'll find that you may not be able to get good execution with a given system, or the risk is much higher than you originally expected, or that the system has too many losses in a row. Trading is a business, not one to be taken casually. As Richard Wyckoff said, "Most men make money in their own business and lose it in some other fellow's." Plan to invest your time before your money, so that when you begin trading, you have more realistic expectations.\ To compete with a professional speculator you must be more accurate in anticipating the next move or in predicting prices from current news-not the article printed in today's newspaper ("Government Approves New AIDS Drug"), which was discounted weeks ago, and not the one on the wire service ("15% Fewer Soybeans and 10% More Fishmeal"), which went into the market two days ago. You must act on news that has not yet been printed. In order to anticipate changes, you must draw a single conclusion for the many contingencies possible from fundamental data, or\ Recognize recurring patterns in price movement and determine the most likely results of such patterns.\ Determine the "trend" of the market by isolating the basic direction of prices over a selected time interval.\ The bar chart, discussed in Chapter 3, is the simplest representation of the market. These patterns are the same as those recognized by Jesse Livermore on the ticker tape. Because they are interpretive, more precise methods such as point-and-figure charting are also used, which add a level of exactness to charting. Point-and-figure charts are popular because they offer specific trading rules and show formations similar to both bar charting and ticker-tape trading.\ Mathematical modeling, using traditional regression or discrete analysis, has become a popular technique for anticipating price direction. Most modeling methods are modifications of developments in econometrics and basic probability and statistical theory. They are precise because they are based entirely on numerical data.\ The proper assessment of the price trend is critical to most trading systems. Countertrend trading, which takes a position opposite to the trend direction, is just as dependent on knowing the trend as a trend-following technique. Large sections of this book are devoted to the various ways to isolate the trend, although it would be an injustice to leave the reader with the idea that a "price trend" is a universally accepted concept. There have been many studies published claiming that price trends do not exist. The most authoritative papers on this topic are collected in Cootner, The Random Character of Stock Market Prices (MIT Press, 1964); more recent and readable discussions can often be found in the Financial Analysts Journal, an excellent resource.\ Personal money management has gained an enormous number of tools during this period of computerized expansion. The major spreadsheet providers include linear regression and correlation analysis; there is also inexpensive software to perform spectral analysis and apply advanced statistical techniques. There is an Excel add-in, Solver, that can easily be adapted to portfolio allocation. Development software such as TradeStation and MetaStock have provided trading platforms and greatly reduced the effort needed to program your ideas. Professionals maintain the advantage of having all of their time to concentrate on the investment problems; however, nonprofessionals are no longer at a disadvantage.\ RANDOM WALK\ It has been the position of many fundamental and economic analysis advocates that there is no sequential correlation in the direction of price movement from one day to the next. That is, prices have no memory of what has come before-this has been named the "random walk" theory. Prices will seek a level that will balance the supply-demand factors, but that this level will be reached either instantaneously, or in an unpredictable manner as prices move in an irregular response to the latest available information or news release.\ If the random walk theory is correct, the many well-defined trading methods based on mathematics and pattern recognition will fail. The problem is not a simple one, but one that should be resolved by each system developer because it will influence the type of systematic approaches studied in this book. There are two arguments against random movement in prices.\ (Continues...)\ \ \ \ \ Excerpted from New Trading Systems and Methods by Perry Kaufman Excerpted by permission.\ All rights reserved. No part of this excerpt may be reproduced or reprinted without permission in writing from the publisher.\ Excerpts are provided by Dial-A-Book Inc. solely for the personal use of visitors to this web site. \ \
Ch. 1Introduction1Ch. 2Basic concepts15Ch. 3Charting59Ch. 4Charting systems and techniques129Ch. 5Event-driven trends153Ch. 6Regression analysis209Ch. 7Time-based trend calculations249Ch. 8Time-based trend systems285Ch. 9Momentum and oscillators347Ch. 10Seasonality403Ch. 11Cycle analysis447Ch. 12Volume, open interest, and breadth483Ch. 13Spreads and arbitrage515Ch. 14Behavioral techniques561Ch. 15Pattern recognition627Ch. 16Day trading699Ch. 17Adaptive techniques731Ch. 18Price distribution systems753Ch. 19Multiple time frames779Ch. 20Advanced techniques791Ch. 21System testing847Ch. 22Practical considerations935Ch. 23Risk control983Ch. 24Diversification and portfolio allocation1043App. 1Statistical tables1083App. 2Method of least squares1087App. 3Matrix solution to linear equations and Markov chains1103App. 4Trigonometric regression for finding cycles1113App. 5Fourier transformation1127App. 6Construction of a pentagon1133
