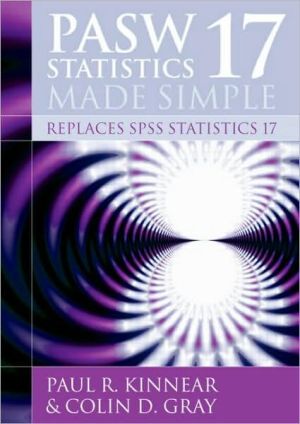
SPSS 17 Made Simple
Reflecting the latest developments in statistics software from SPSS Inc., this new edition of one of the most widely read textbooks in its field keeps the reader abreast of the latest improvements in PASW Statistics 17 (the new name for SPSS Statistics 17).\ This friendly and informal textbook is a non-technical and readable introduction to one of the most powerful and versatile statistical packages on the market. The new edition combines clarity of presentation with coverage of the latest...
Search in google:
The latest edition of one of the most widely read textbooks in its field. While being updated to cover the new features of SPSS 17 (now PASW Statistics 17), the book continues to be useful to readers with earlier releases of the SPSS, inc. software.
Preface xvChapter 1 Introduction 11.1 Measurements and Data 11.1.1 Variables: quantitative and qualitative 11.1.2 Levels of measurement: scale, ordinal and nominal data 21.1.3 A grey area: ratings 21.1.4 Univariate, bivariate and multivariate data sets 31.2 Experimental Versus Correlational Research 31.2.1 A simple experiment 31.2.2 A more complex experiment 41.2.3 Correlational research 51.2.4 The Pearson correlation coefficient 71.2.5 Correlation and causation 81.2.6 Quasi-experiments 81.3 Choosing A Statistical Test: Some Guidelines 81.3.1 Considerations in choosing a statistical test 91.3.2 Five common research situations 91.4 Is A Difference Significant? 101.4.1 The design of the experiment: independent versus related samples 101.4.2 Flow chart for selecting a suitable test for differences between means 111.5 Are Two Variables Associated? 131.5.1 Flow chart for selecting a suitable test for association 131.5.2 Measuring association in ordinal data 141.5.3 Measuring association in nominal data: Contingency tables 141.5.4 Multi-way contingency tables 151.6 Can We Predict a Score From Scores on Other Variables? 151.6.1 Flow chart for predicting a score or category membership 151.6.2 Simple regression 161.6.3 Multiple regression 161.6.4 Predicting category membership: Discriminant analysis and logistic regression 171.7 From Sample to Population 171.7.1 Flow chart for selecting the appropriate one-sample test 171.7.2 Goodness-of-fit: scale data 181.7.3 Goodness-of-fit: nominal data 181.7.4 Inferences about the mean of a single population 181.8 TheSearch For Latent Variables 191.9 Multivariate Statistics 191.10 Some Statistical Terms and Concepts 201.10.1 Description or confirmation? 201.10.2 Samples and populations 201.10.3 Parameters and statistics 211.10.4 Statistical inference 211.10.5 One-sample and two-sample tests of hypotheses about means 241.10.6 Sampling distributions 251.10.7 The standard normal distribution 261.10.8 When the population variance and standard deviation are unknown: the t distribution 281.10.9 Errors in hypothesis testing 321.11 A Final Word 34Recommended reading 35Chapter 2 Getting started with PASW Statistics 17.0 362.1 Outline of a PASW Session 362.1.1 Entering the data 362.1.2 Selecting the exploratory and statistical procedures 372.1.3 Examining the output 372.1.4 A simple experiment 372.1.5 Preparing data for PASW 382.2 Opening PASW 392.3 The PASW Statistics Data Editor 402.3.1 Working in Variable View 402.3.2 Working in Data View 452.3.3 Entering the data 452.4 A Statistical Analysis 492.4.1 An example: Computing means 492.4.2 Keeping more than one application open 532.5 Closing PASW 532.6 Resuming Work on a Saved Data Set 53Exercise 1 Some simple operations with PASW Statistics 17.0 53Exercise 2 Questionnaire data 53Chapter 3 Editing and manipulating files 543.1 More About the PASW Statistics Data Editor 543.1.1 Working in Variable View 543.1.2 Working in Data View 613.2 More on The PASW Statistics Viewer 683.2.1 Editing the output 693.2.2 More advanced editing 703.2.3 Tutorials in PASW 743.3 Selecting From and Manipulating Data Files 743.3.1 Selecting cases 743.3.2 Aggregating data 773.3.3 Sorting data 793.3.4 Merging files 803.3.5 Transposing the rows and columns of a data set 853.4 Importing and Exporting Data 873.4.1 Importing data from other applications 873.4.2 Copying output 903.5 Printing From PASW 923.5.1 Printing output from the Viewer 92Exercise 3 Merging files - Adding cases & variables 97Chapter 4 Exploring your data 984.1 Introduction 984.1.1 The influence of outliers and asymmetry of distribution 994.2 Some Useful Menus 994.3 Describing Data 1014.3.1 Describing nominal and ordinal data 1014.3.2 Describing measurements 1084.4 Manipulation of the Data Set 1224.4.1 Reducing and transforming data 1224.4.2 The Compute procedure 1234.4.3 The Recode and Visual Binning procedures 129Exercise 4 Correcting and preparing your data 136Exercise 5 Preparing your data (continued) 136Chapter 5 Graphs and charts 1375.1 Introduction 1375.1.1 Graphs and charts on PASW 1375.1.2 Viewing a chart 1405.1.3 Editing charts and saving templates 1405.2 Bar Charts 1415.2.1 Simple bar charts 1415.2.2 Clustered bar charts 1445.2.3 Panelled bar charts 1465.2.4 3-D charts 1475.2.5 Editing a bar chart 1495.2.6 Chart templates 1515.3 Error Bar Charts 1545.4 Boxplots 1555.5 Pie Charts 1575.6 Line Graphs 1595.7 Scatterplots and Dot Plots 1625.7.1 Scatterplots 1625.7.2 Dot plots 1645.8 Dual Y-Axis Graphs 1655.9 Histograms 1675.10 Receiver-Operating-Characteristic (ROC) Curve 1695.10.1 The PASW ROC curve 1705.10.2 The d' statistic 173Exercise 6 Charts and graphs 174Exercise 7 Recording data; selecting cases; line graph 174Chapter 6 Comparing averages: Two-sample and one-sample tests 1756.1 Overview 1756.2 Comparing Means: The Independent-Samples T Test With PASW 1766.2.1 Preparing the data file 1766.2.2 Exploring the data 1776.2.3 Running the t test 1796.2.4 Interpreting the output 1816.2.5 Two-tailed and one-tailed p-values 1826.2.6 The effects of extreme scores and outliers in a small data set 1836.2.7 Measuring effect size 1836.2.8 Reporting the results of a statistical test 1856.3 The Related-Samples (or Paired-Samples) T Test With PASW 1866.3.1 Preparing the data file 1876.3.2 Exploring the data 1876.3.3 Running the t test 1886.3.4 Interpreting the output 1896.3.5 Measuring effect size 1906.3.6 Reporting the results of the test 1906.3.7 A one-sample test 1916.4 The Mann-Whitney U Test 1916.4.1 Nonparametric test in PASW 1916.4.2 Independent samples: The Mann-Whitney U test 1926.4.3 Output for the Mann-Whitney U test 1946.4.4 Effect size 1946.4.5 The report 1956.5 The Wilcoxon Matched-Pairs Test 1966.5.1 The Wilcoxon matched-pairs tests in PASW 1966.5.2 The output 1976.5.3 Effect size 1986.5.4 The report 1986.6 The Sign And Binomial Tests 1986.6.1 The sign test in PASW 1996.6.2 Bernoulli trials: the binomial test 2016.7 Effect Size, Power and the Number of Participants 2046.7.1 How many participants shall I need in my experiment? 2046.8 A Final Word 206Exercise 8 Comparing the averages of two independent samples of data 206Exercise 9 Comparing the averages of two related samples of data 206Exercise 10 One-sample tests 206Chapter 7 The one-way ANOVA 2077.1 Introduction 2077.1.1 A more complex drug experiment 2077.1.2 ANOVA models 2087.1.3 The one-way ANOVA 2087.2 The One-Way ANOVA (Compare Means Menu) 2157.2.1 Entering the data 2157.2.2 Running the one-way ANOVA 2187.2.3 The output 2187.2.4 Effect size 2197.2.5 Report of the primary analysis 2227.2.6 The two-group case: equivalence of F and t 2227.3 The One-Way ANOVA (GLM Menu) 2237.3.1 Factors with fixed and random effects 2237.3.2 The analysis of covariance (ANCOVA) 2247.3.3 Univariate versus multivariate statistical tests 2247.3.4 The one-way ANOVA with GLM 2247.3.5 The GLM output 2267.3.6 Requesting additional items 2277.3.7 Additional output from GLM 2297.4 Making Comparisons Among the Treatment Means 2327.4.1 Planned and unplanned comparisons 2327.4.2 Linear contrasts 2367.5 Trend Analysis 2477.5.1 Polynomials 2487.6 Power and Effect Size in the One-Way ANOVA 2497.6.1 How many participants shall I need? Using GPower 3 2507.7 Alternatives to the One-Way ANOVA 2527.7.1 The Kruskal-Wallis k-sample test 2527.7.2 Dichotomous nominal data: the chi-square test 2597.8 A Final Word 259Recommended reading 260Exercise 11 One-factor between subjects ANOVA 260Appendix 7.4.2.4 Partition of the between groups sum of squares into the sums of squares of the contrasts in an orthogonal set 260Appendix 7.5.1 An Illustration of trend analysis 261Chapter 8 Between subjects factorial experiments 2658.1 Introduction 2658.1.1 An experiment with two treatment factors 2658.1.2 Main effects and interactions 2678.1.3 Profile plots 2678.2 How the Two-Way ANOVA Works 2698.2.1 The two-way ANOVA 2698.2.2 Degrees of freedom 2708.2.3 The two-way ANOVA summary table 2718.3 The Two-Way ANOVA A With PASW 2728.3.1 Entering the data for the factorial ANOVA 2738.3.2 Exploring the data: boxplots 2748.3.3 Choosing a factorial ANOVA 2748.3.4 Output for a factorial ANOVA 2768.3.5 Measuring effect size in the two-way ANOVA 2788.3.6 Reporting the results of the two-way ANOVA 2818.4 Further Analysis 2828.4.1 The danger with multiple comparisons 2828.4.2 Unpacking significant main effects: post hoc tests 2828.4.3 The analysis of interactions 2838.5 Testing For Simple Main Effects With Syntax 2858.5.1 The syntax editor 2858.5.2 Building syntax files automatically 2868.5.3 Using the MANOVA command to run the univariate ANOVA 2868.6 How Many Participants Shall I Need For My Two-Factor Experiment? 2948.7 More Complex Experiments 2948.7.1 Three-way interactions 2958.7.2 The three-way ANOVA 2968.7.3 How the three-way ANOVA works 2978.7.4 Measures of effect size in the three-way ANOVA 2998.7.5 How many participants shall I need? 2998.7.6 The three-way ANOVA with PASW 2998.7.7 Follow-up analysis following a significant three-way interaction 3028.7.8 Using PASW syntax to test for simple interactions and simple, simple main effects 3038.7.9 Unplanned multiple comparisons following a significant three-way interaction 3068.8 A Final Word 309Recommended reading 309Exercise 12 Between subjects factorial ANOVA (two-way ANOVA) 309Chapter 9 Within subjects experiments 3109.1 Introduction 3109.1.1 Rationale of a within subjects experiment 3109.1.2 How the within subjects ANOVA works 3119.1.3 A within subjects experiment on the effect of target shape on shooting accuracy 3149.1.4 Order effects: counterbalancing 3159.1.5 Assumptions underlying the within subjects ANOVA: homogeneity of covariance 3159.2 A One-Factor Within Subjects ANOVA with PASW 3179.2.1 Entering the data 3179.2.2 Exploring the data: Boxplots for within subjects factors 3179.2.3 Running the within subjects ANOVA 3199.2.4 Output for a one-factor within subjects ANOVA 3239.2.5 Effect size in the within subjects ANOVA 3279.3 Power and Effect Size: How Many Participants Shall I Need? 3299.4 Nonparametric Equivalents of the Within Subjects ANOVA 3309.4.1 The Friedman test for ordinal data 3309.4.2 Cochran's Q test for nominal data 3339.5 The Two-Factor Within Subjects ANOVA 3349.5.1 Preparing the data set 3369.5.2 Running the two-factor within subjects ANOVA 3369.5.3 Output for a two-factor within subjects ANOVA 3399.5.4 Unpacking a significant interaction with multiple comparisons 3439.6 A Final Word 345Recommended reading 346Exercise 13 One-factor within subjects (repeated measures) ANOVA 346Exercise 14 Two-factor within subjects ANOVA 346Chapter 10 Mixed factorial experiments 34710.1 Introduction 34710.1.1 A mixed factorial experiment 34710.1.2 Classifying mixed factorial designs 34810.1.3 Rationale of the mixed ANOVA 34910.2 The Two-Factor Mixed Factorial ANOVA with PASW 35110.2.1 Preparing the PASW data set 35110.2.2 Exploring the results: Boxplots 35210.2.3 Running the ANOVA 35310.2.4 Output for the two-factor mixed ANOVA 35510.2.5 Simple effects analysis with syntax 36010.3 The Three-Factor Mixed ANOVA 36510.3.1 The two three-factor designs 36510.3.2 Two within subjects factors 36610.3.3 Using syntax to test for simple effects 37110.3.4 One within subjects factor and two between subjects factors: the AxBx(C) mixed factorial design 37510.4 The Multivariate Analysis of Variance (MANOVA) 38210.4.1 What the MANOVA does 38210.4.2 How the MANOVA works 38410.4.3 Assumptions of MANOVA 38710.4.4 Application of MANOVA to the shape recognition experiment 38710.5 A Final Word 391Recommended reading 392Exercise 15 Mixed ANOVA: two-factor experiment 392Exercise 16 Mixed ANOVA: three-factor experiment 392Chapter 11 Measuring statistical association 39311.1 Introduction 39311.1.1 A correlational study 39411.1.2 Linear relationships 39511.1.3 Error in measurement 39511.2 The Pearson Correlation 39611.2.1 Formula for the Pearson correlation 39611.2.2 The range of values of the Pearson correlation 39711.2.3 The sign of a correlation 39711.2.4 Testing an obtained value of r for significance 39811.2.5 A word of warning about the correlation coefficient 39911.2.6 Effect size 39911.3 Correlation with PASW 40111.3.1 Preparing the PASW data set 40211.3.2 Obtaining the scatterplot 40211.3.3 Obtaining the Pearson correlation 40311.3.4 Output for the Pearson correlation 40411.4 Other Measures of Association 40511.4.1 Spearman's rank correlation 40511.4.2 Kendall's tau statistics 40611.4.3 Rank correlations with PASW 40611.5 Nominal Data 40811.5.1 The approximate chi-square goodness-of-fit test with three or more categories 40811.5.2 Running a chi-square goodness-of-fit test on PASW 40911.5.3 Measuring effect size following a chi-square test of goodness-of-fit 41211.5.4 Testing for association between two qualitative variables in a contingency table 41411.5.5 Analysis of contingency tables with PASW 41911.5.6 Getting help with the output 42511.5.7 Some cautions and caveats 42611.5.8 Other problems with traditional chi-square analyses 43111.6 Do Doctors Agree? Cohen's Kappa 43211.7 Partial Correlation 43411.7.1 Correlation does not imply causation 43411.7.2 Meaning of partial correlation 43511.8 Correlation in Mental Testing: Reliability 43711.8.1 Reliability and number of items: coefficient alpha 43811.8.2 Measuring agreement among judges: the intraclass correlation 44011.8.3 Reliability analysis with PASW 44111.9 A Final Word 443Recommended reading 443Exercise 17 The Pearson correlation 443Exercise 18 Other measures of association 443Exercise 19 The analysis of nominal data 443Chapter 12 Regression 44412.1 Introduction 44412.1.1 Simple, two-variable regression 44412.1.2 Residuals 44612.1.3 The least squares criterion 44712.1.4 Partition of the sum of squares in regression 44712.1.5 Effect size in regression 44912.1.6 Shrinkage 45012.1.7 Regression models 45012.1.8 Beta-weights 45112.1.9 Significance testing in simple regression 45212.2 Simple Regression with PASW 45312.2.1 Drawing scatterplots with regression lines 45312.2.2 A problem in simple regression 45512.2.3 Procedure for simple regression 45612.2.4 Output for simple regression 45912.3 Multiple Regression 46412.3.1 The multiple correlation coefficient R 46512.3.2 Significance testing in multiple regression 46612.3.3 Partial and semipartial correlation 46712.4 Multiple Regression with PASW 47212.4.1 Simultaneous multiple regression 47412.4.2 Stepwise multiple regression 47712.5 Regression and Analysis of Variance 48012.5.1 The point-biserial correlation 48012.5.2 Regression and the one-way ANOVA for two groups 48112.5.3 Regression and dummy coding: the two-group case 48312.5.4 Regression and the one-way ANOVA 48512.6 Multilevel Regression Models 48912.7 A Final Word 489Recommended reading 489Exercise 20 Simple, two-variable regression 490Exercise 21 Multiple regression 490Chapter 13 Analyses of multiway frequency tables & multiple response sets 49113.1 Introduction 49113.1.1 Multiple response sets 49213.2 Some Basics of Loglinear Modelling 49213.2.1 Loglinear models and ANOVA models 49313.2.2 Model-building and the hierarchical principle 49413.2.3 The main-effects-only loglinear model and the traditional chi-square test for association 49713.2.4 Analysis of the residuals 49713.3 Modelling A Two-Way Contingency Table 49813.3.1 PASW procedures for loglinear analysis 49813.3.2 Fitting an unsaturated model 50413.3.3 Summary 50813.4 Modelling a Three-Way Frequency Table 50813.4.1 Exploring the data 50913.4.2 Loglinear analysis of the data on gender and helpfulness 51013.4.3 The main-effects-only model and the traditional chi-square test 51413.4.4 Collapsing a multi-way table: the requirement of conditional independence 51613.4.5 An alternative data set for the gender and helpfulness experiment 51813.4.6 Reporting the results of a loglinear analysis 52113.5 Multiple Response Sets 52113.5.1 How PASW produces multiple response profiles 52213.6 A Final Word 530Recommended reading 530Exercise 22 Loglinear analysis 531Chapter 14 Discriminant analysis and logistic regression 53214.1 Introduction 53214.1.1 Discriminant analysis 53314.1.2 Types of discriminant analysis 53414.1.3 Stepwise Discriminant analysis 53414.1.4 Restrictive assumptions of discriminant analysis 53514.2 Discriminant Analysis With PASW 53514.2.1 Preparing the data set 53614.2.2 Exploring the data 53614.2.3 Running discriminant analysis 53714.2.4 Output for discriminant analysis 53914.2.5 Predicting group membership 54714.3 Binary Logistic Regression 54914.3.1 Logistic regression 54914.3.2 How logistic regression works 55114.3.3 An example of a binary logistic regression with quantitative independent variables 55314.3.4 Binary logistic regression with categorical independent variables 56214.4 Multinomial Logistic Regression 56514.4.1 Running multinomial logistic regression 56614.5 A Final Word 569Recommended reading 570Exercise 23 Predicting category membership: Discriminant analysis and binary logistic regression 570Chapter 15 Latent variables: exploratory factor analysis & canonical correlation 57115.1 Introduction 57115.1.1 Stages in an exploratory factor analysis 57315.1.2 The extraction of factors 57415.1.3 The rationale of rotation 57415.1.4 Some issues in factor analysis 57415.1.5 Some key technical terms 57515.2 A Factor Analysis of Data on Six Variables 57615.2.1 Entering the data for a factor analysis 57615.2.2 Running a factor analysis on PASW 57615.2.3 Output for factor analysis 57915.3 Using PASW SYNTAX to Run a Factor Analysis 59015.3.1 Running a factor analysis with PASW syntax 59015.3.2 Using a correlation matrix as input for factor analysis 59015.3.3 Progressing with PASW syntax 59315.4 Canonical Correlation 59315.4.1 Running canomical correlation on PASW 59415.4.2 Output for canonical correlation 59515.5 A Final Word 600Recommended reading 601Exercise 24 Factor analysis 601Appendix 602Glossary 605References 624Index 626
